
MATLAB: An Introduction with Applications
6th Edition
ISBN: 9781119256830
Author: Amos Gilat
Publisher: John Wiley & Sons Inc
expand_more
expand_more
format_list_bulleted
Related questions
Question
How to do this graph by using linear regression in R? Thanks.
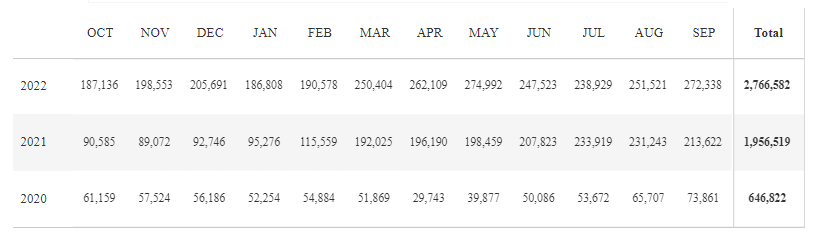

Transcribed Image Text:The table presents monthly data across three years: 2020, 2021, and 2022. Each row corresponds to a year, and each column represents a month from October to September, followed by the total for each year.
### Monthly Data
- **2022**
- October: 187,136
- November: 198,553
- December: 205,691
- January: 186,808
- February: 190,578
- March: 250,404
- April: 262,109
- May: 274,992
- June: 247,523
- July: 238,929
- August: 251,521
- September: 272,338
- **Total:** 2,766,582
- **2021**
- October: 90,585
- November: 89,072
- December: 92,746
- January: 95,276
- February: 115,559
- March: 192,025
- April: 196,190
- May: 198,459
- June: 207,823
- July: 233,919
- August: 231,243
- September: 213,622
- **Total:** 1,956,519
- **2020**
- October: 61,159
- November: 57,524
- December: 56,186
- January: 52,254
- February: 54,884
- March: 51,869
- April: 29,743
- May: 39,377
- June: 50,086
- July: 53,672
- August: 65,707
- September: 73,861
- **Total:** 646,822
### Analysis
This table illustrates a trend of increasing values year over year from 2020 to 2022, with the highest annual total observed in 2022. Each year's monthly figures contribute to a significant overall increase in total values, highlighting a steady growth pattern.
Expert Solution
This question has been solved!
Explore an expertly crafted, step-by-step solution for a thorough understanding of key concepts.

This is a popular solution

Trending nowThis is a popular solution!

Step by stepSolved in 2 steps with 2 images

Follow-up Questions
Read through expert solutions to related follow-up questions below.
Follow-up Question
How will I get output of linear regression formula? Thanks.
Solution
by Bartleby Expert
Follow-up Questions
Read through expert solutions to related follow-up questions below.
Follow-up Question
How will I get output of linear regression formula? Thanks.
Solution
by Bartleby Expert
Knowledge Booster

Similar questions
- how you will calculate the degrees of freedom in multiple linear regression and in simple linear regression?arrow_forwardWhat is regression R2 ? Explain both with formula and its meaning in a linear regression model? What does it mean if you have a low regression R2 ?arrow_forwardWhat other methods could one try if a linear regression does not perform well?arrow_forward
- Residual analysis is important when studying the potential for linear regression because it allows for assumptions to be ignored for a time while graphs are created. True O Falsearrow_forwardA particular article proposed a quadratic regression model to describe the relationship between x = degree of delignification during the processing of wood pulp for paper and y = total chlorine content. Suppose that the actual model is the following. y=245+ 75x-4x² + e (a) Mean chlorine content for x = 6 is ---Select--- mean chlorine content for x = 8. (b) What is the change in mean chlorine content when the degree of delignification increases from 8 to 9? What is the change in mean chlorine content when the degree of delignification increases from 12 to 13?arrow_forwardNeed help finishing the regression equation with the following: Y=Residents' Preference B=Size of sector budget, sector budget, and individual trust as Independent Variables. I'm using Jamovi software, but the need to create the equation with information above. Thanks,arrow_forward
arrow_back_ios
arrow_forward_ios
Recommended textbooks for you
- MATLAB: An Introduction with ApplicationsStatisticsISBN:9781119256830Author:Amos GilatPublisher:John Wiley & Sons Inc
 Probability and Statistics for Engineering and th...StatisticsISBN:9781305251809Author:Jay L. DevorePublisher:Cengage Learning
 Statistics for The Behavioral Sciences (MindTap C...StatisticsISBN:9781305504912Author:Frederick J Gravetter, Larry B. WallnauPublisher:Cengage Learning
  Elementary Statistics: Picturing the World (7th E...StatisticsISBN:9780134683416Author:Ron Larson, Betsy FarberPublisher:PEARSON
 The Basic Practice of StatisticsStatisticsISBN:9781319042578Author:David S. Moore, William I. Notz, Michael A. FlignerPublisher:W. H. Freeman
 Introduction to the Practice of StatisticsStatisticsISBN:9781319013387Author:David S. Moore, George P. McCabe, Bruce A. CraigPublisher:W. H. Freeman
MATLAB: An Introduction with Applications
Statistics
ISBN:9781119256830
Author:Amos Gilat
Publisher:John Wiley & Sons Inc
Probability and Statistics for Engineering and th...
Statistics
ISBN:9781305251809
Author:Jay L. Devore
Publisher:Cengage Learning
Statistics for The Behavioral Sciences (MindTap C...
Statistics
ISBN:9781305504912
Author:Frederick J Gravetter, Larry B. Wallnau
Publisher:Cengage Learning
Elementary Statistics: Picturing the World (7th E...
Statistics
ISBN:9780134683416
Author:Ron Larson, Betsy Farber
Publisher:PEARSON
The Basic Practice of Statistics
Statistics
ISBN:9781319042578
Author:David S. Moore, William I. Notz, Michael A. Fligner
Publisher:W. H. Freeman
Introduction to the Practice of Statistics
Statistics
ISBN:9781319013387
Author:David S. Moore, George P. McCabe, Bruce A. Craig
Publisher:W. H. Freeman