
MATLAB: An Introduction with Applications
6th Edition
ISBN: 9781119256830
Author: Amos Gilat
Publisher: John Wiley & Sons Inc
expand_more
expand_more
format_list_bulleted
Related questions
Question
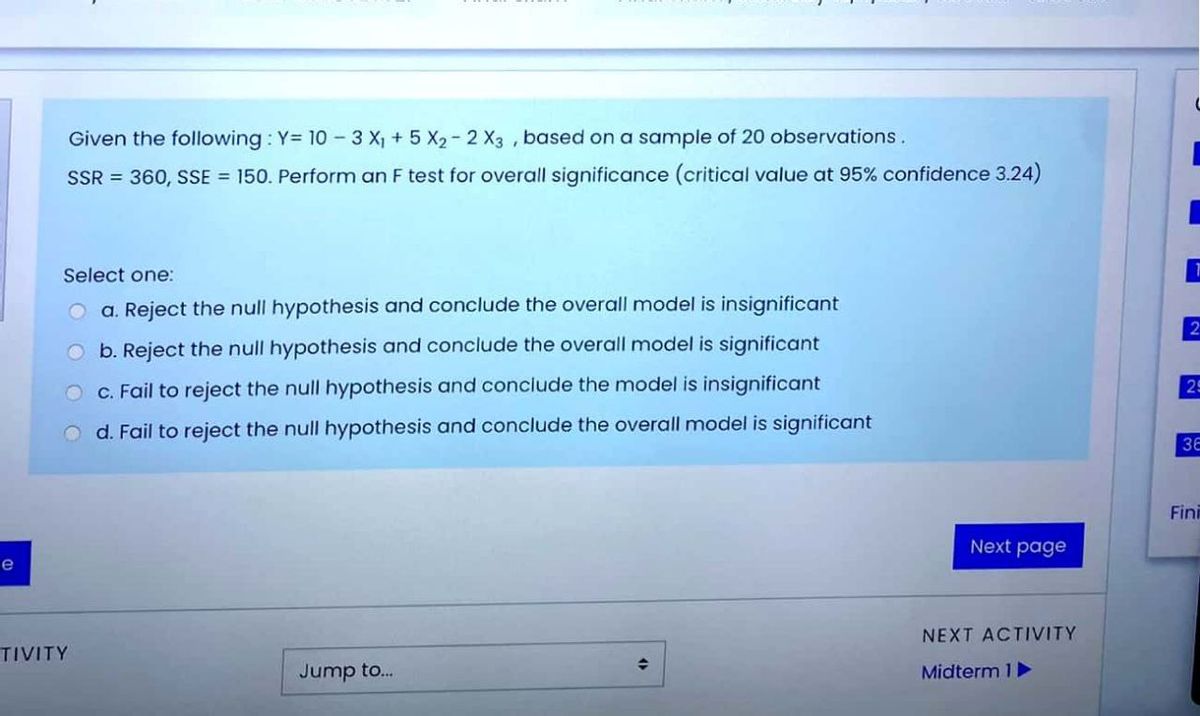

Transcribed Image Text:Given the following : Y= 10 - 3 X, +5 X2- 2 X3 , based on a sample of 20 observations.
SSR = 360, SSE = 150. Perform an F test for overall significance (critical value at 95% confidence 3.24)
Select one:
a. Reject the null hypothesis and conclude the overall model is insignificant
2
b. Reject the null hypothesis and conclude the overall model is significant
O C. Fail to reject the null hypothesis and conclude the model is insignificant
29
O d. Fail to reject the null hypothesis and conclude the overall model is significant
36
Fini
Next page
e
NEXT ACTIVITY
TIVITY
Jump to...
Midterm 1
Expert Solution
This question has been solved!
Explore an expertly crafted, step-by-step solution for a thorough understanding of key concepts.

Step by stepSolved in 2 steps with 2 images

Knowledge Booster

Similar questions
- Which of the following is the best decision and conclusion based on the result below? H.: p = 0.10 Ha:p + 0.10 Critical Value: +1.645 Computed Test Statistics: z = 5.61 O a. Since the computed test statistics is less than the critical value, do not reject Ho. Therefore, we conclude that at 0.10 level of significance, there is enough evidence that the population proportion is different from 10%. O b. Since the computed test statistics is less than the critical value, do not reject Ho. Therefore, we conclude that at 0.10evel of significance, there is enough evidence that the population proportion is different from 10%. O c. Since the computed test statistics is greater than the critical value, reject Ho. Therefore, we conclude that at 0.10 level of significance, there is enough evidence that the population proportion is different from 10%. O d. Since the computed test statistics is less than the critical value, reject Ho. Therefore, we conclude that at 0.10 level of significance, there…arrow_forwardA Chi square test has been conducted to assess the relationship between marital status and church attendance. The obtained Chi square is 7.45 and the critical Chi square is 9.488. What may be concluded? Group of answer choices A.reject the null hypothesis, church attendance and marital status are independent B.fail to reject the null hypothesis, church attendance and marital status are independent C.Reject the null hypothesis, church attendance and marital status are dependent D.fail to reject the null hypothesis, church attendance and marital status are dependentarrow_forwarda. State the null and research hypotheses: H0: H1: b. Is the F statistic for Levene’s test significant? c. What is the alpha level for the t-test? d. Obtained t-value: e. Significance level for the t-test: f. Decision rule: If the significance level of the obtained t statistic is greater than ____ (alpha level), we fail to reject the null hypothesis. If the significance level of the obtained t statistic is equal to or less than ____ (alpha level), we reject the null hypothesis. g. Decision: Since the significance level of the obtained t statistic is _____ and it is __________(greater or less) than ____ (alpha level), we ________(reject or fail to reject) the null hypothesis. h. Interpretation/conclusion:arrow_forward
- Assume a significance level of α=0.1 and use the given information to complete parts (a) and (b) below. Original claim: The mean pulse rate (in beats per minute) of a certain group of adult males is 70 bpm. The hypothesis test results in a P-value of 0.0025. a. State a conclusion about the null hypothesis. (Reject H0 or fail to reject H0.) Choose the correct answer below. A. Fail to reject H0 because the P-value is less than or equal to α. B. Reject H0 because the P-value is less than or equal to α. C. Reject H0 because the P-value is greater than α. D. Fail to reject H0 because the P-value is greater than α. b. Without using technical terms, state a final conclusion that addresses the original claim. Which of the following is the correct conclusion? A. The mean pulse rate (in beats per minute) of the group of adult males is 70 bpm. B. There is sufficient evidence to warrant rejection of the claim that the…arrow_forwardA researcher uses a between-subjects ANOVA to compare the mean SAT scores from 5 school districts in the state of Idaho. He computes the following test statistic: F(4, 15) = 6.23. School District 1 2 3 4 5 M 500 560 480 430 450 SD 100 120 130 110 140 The critical value = 5.87. State the appropriate decision (reject/fail to reject) regarding the null hypothesis (alpha = 0.05). Then give a brief explanation of what the results mean in the context of this study, given the information you have been provided. I'm not looking for APA here. If you were to reject or fail to reject the null, simply explain what that means using language that anyone should be able to understandarrow_forward3. For a z-test we get a test statistic of z=2.05. If our alternative hypothesis is "??:?>13Ha:μ>13", what Excel command would we use to compute the P-value? If our alternative hypothesis is "??:?<13Ha:μ<13", what Excel command would se use to compute the P-value?arrow_forward
- A hypothesis test will be conducted and after summarinzing the data, the observed test statistic is z = 1.9. Explain how much evidence we have against the null hypothesis (H0) and for the alternative hypothesis (Ha) in each of the following sets of hypotheses: Explain the reason that the answer differs depending on the chosen alternative hypothesis.arrow_forwardThe NAEP considers that a national average of 283 is an acceptable performance. Using α = .05, run a two-tail t-test for one sample to test Ho: µ=283 for the 2019 scores. Report the t-obt, df, and p-values. Would you reject the null hypothesis that the 2019 scores come from a population with average 283? If this is the case, does it come from a population from larger or smaller average?arrow_forward8.2 Use technology to find the P-value for the hypothesis test described below. The claim is that for a smartphone carrier's data speeds at airports, the mean is μ=17.00 Mbps. The sample size is n=21 and the test statistic is t=−1.798arrow_forward
- Women athletes at a certain university have a long-term graduation rate of 67%. Over the past several years, a random sample of 38 women athletes at the school showed that 21 eventually graduated. Does this indicate that the population proportion of women athletes who graduate from the university is now less than 67%? Use a 1% level of significance. State the null and alternate hypotheses. H0: p = 0.67; H1: p < 0.67 H0: p = 0.67; H1: p > 0.67 H0: p = 0.67; H1: p ≠ 0.67 H0: p < 0.67; H1: p = 0.67 What sampling distribution will you use? The standard normal, since np < 5 and nq < 5. The Student's t, since np > 5 and nq > 5. The standard normal, since np > 5 and nq > 5. The Student's t, since np < 5 and nq < 5. What is the value of the sample test statistic? (Round your answer to two decimal places.) Find the P-value of the test statistic. (Round your answer to four decimal places.) Based on your answers in parts (a) to…arrow_forward12.5.4VO2-max Aerobic Fitness Measurements Consider the data set of aerobic fitness measurements given in DS 12.2.3. Construct and interpret a two-sided 95% prediction interval for the VO2-max measurement of a new experimental subject who is a 50-year-old male.arrow_forward
arrow_back_ios
arrow_forward_ios
Recommended textbooks for you
- MATLAB: An Introduction with ApplicationsStatisticsISBN:9781119256830Author:Amos GilatPublisher:John Wiley & Sons Inc
 Probability and Statistics for Engineering and th...StatisticsISBN:9781305251809Author:Jay L. DevorePublisher:Cengage Learning
 Statistics for The Behavioral Sciences (MindTap C...StatisticsISBN:9781305504912Author:Frederick J Gravetter, Larry B. WallnauPublisher:Cengage Learning
  Elementary Statistics: Picturing the World (7th E...StatisticsISBN:9780134683416Author:Ron Larson, Betsy FarberPublisher:PEARSON
 The Basic Practice of StatisticsStatisticsISBN:9781319042578Author:David S. Moore, William I. Notz, Michael A. FlignerPublisher:W. H. Freeman
 Introduction to the Practice of StatisticsStatisticsISBN:9781319013387Author:David S. Moore, George P. McCabe, Bruce A. CraigPublisher:W. H. Freeman
MATLAB: An Introduction with Applications
Statistics
ISBN:9781119256830
Author:Amos Gilat
Publisher:John Wiley & Sons Inc
Probability and Statistics for Engineering and th...
Statistics
ISBN:9781305251809
Author:Jay L. Devore
Publisher:Cengage Learning
Statistics for The Behavioral Sciences (MindTap C...
Statistics
ISBN:9781305504912
Author:Frederick J Gravetter, Larry B. Wallnau
Publisher:Cengage Learning
Elementary Statistics: Picturing the World (7th E...
Statistics
ISBN:9780134683416
Author:Ron Larson, Betsy Farber
Publisher:PEARSON
The Basic Practice of Statistics
Statistics
ISBN:9781319042578
Author:David S. Moore, William I. Notz, Michael A. Fligner
Publisher:W. H. Freeman
Introduction to the Practice of Statistics
Statistics
ISBN:9781319013387
Author:David S. Moore, George P. McCabe, Bruce A. Craig
Publisher:W. H. Freeman