Fundamentals of Financial Management, Concise Edition (MindTap Course List)
9th Edition
ISBN: 9781305635937
Author: Eugene F. Brigham, Joel F. Houston
Publisher: Cengage Learning
expand_more
expand_more
format_list_bulleted
Question
Can you please give me correct answer the general accounting question?

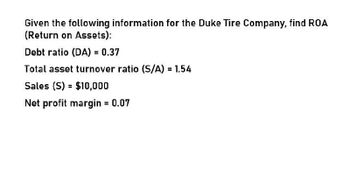
Transcribed Image Text:Given the following information for the Duke Tire Company, find ROA
(Return on Assets):
Debt ratio (DA) = 0.37
Total asset turnover ratio (S/A) = 1.54
Sales (S) = $10,000
Net profit margin = 0.07
Expert Solution
This question has been solved!
Explore an expertly crafted, step-by-step solution for a thorough understanding of key concepts.
Step by stepSolved in 2 steps

Knowledge Booster
Similar questions
- General Accounting Question please solve this onearrow_forwardSilver Creek Technologies has the following financial information: please answer the financial accounting questionarrow_forwardUsing the statements provided Calculate the following liquidity ratios: Current ratio Quick ratio Calculate the following asset management ratios: Average collection period Inventory turnover Fixed asset turnover Total asset turnover Calculate the following financial leverage ratios Debt to equity ratio Long-term debt to equity Calculate the following profitability ratios: Gross profit margin Net profit margin Return on assets Return on stockholders’ equity For example: you should present it like the text, or as:Gross margin = 1,933 divided by 8,689 = 22.2% A competitor of ACME has for the same time period reported the following three ratios: Current ratio 1.52Long-term debt to equity .25 or 25%Net profit margin .08 or 8% Given these three ratios only which company is performing better on each ratio? Also overall who would you say has the best financial performance and position. Support your answer.arrow_forward
- Financial metricsfor crystal GlobeTravel include a total asset turnoverof 1,25 and a return equity of14,30 %, and a debit ratio of 15 % with total asset amounting to R3588 as per the statementof financial position, and considering the financing structure comprising both debt and equity,what is the net profit margin of the company?arrow_forwardNeed helparrow_forwardNeed Answer pleasearrow_forward
arrow_back_ios
SEE MORE QUESTIONS
arrow_forward_ios
Recommended textbooks for you
 Fundamentals of Financial Management, Concise Edi...FinanceISBN:9781305635937Author:Eugene F. Brigham, Joel F. HoustonPublisher:Cengage Learning
 Managerial Accounting: The Cornerstone of Busines...AccountingISBN:9781337115773Author:Maryanne M. Mowen, Don R. Hansen, Dan L. HeitgerPublisher:Cengage Learning
 Intermediate Financial Management (MindTap Course...FinanceISBN:9781337395083Author:Eugene F. Brigham, Phillip R. DavesPublisher:Cengage Learning

Fundamentals of Financial Management, Concise Edi...
Finance
ISBN:9781305635937
Author:Eugene F. Brigham, Joel F. Houston
Publisher:Cengage Learning

Managerial Accounting: The Cornerstone of Busines...
Accounting
ISBN:9781337115773
Author:Maryanne M. Mowen, Don R. Hansen, Dan L. Heitger
Publisher:Cengage Learning

Intermediate Financial Management (MindTap Course...
Finance
ISBN:9781337395083
Author:Eugene F. Brigham, Phillip R. Daves
Publisher:Cengage Learning