
FINANCIAL ACCOUNTING
10th Edition
ISBN: 9781259964947
Author: Libby
Publisher: MCG
expand_more
expand_more
format_list_bulleted
Related questions
Concept explainers
Question

Transcribed Image Text:CO
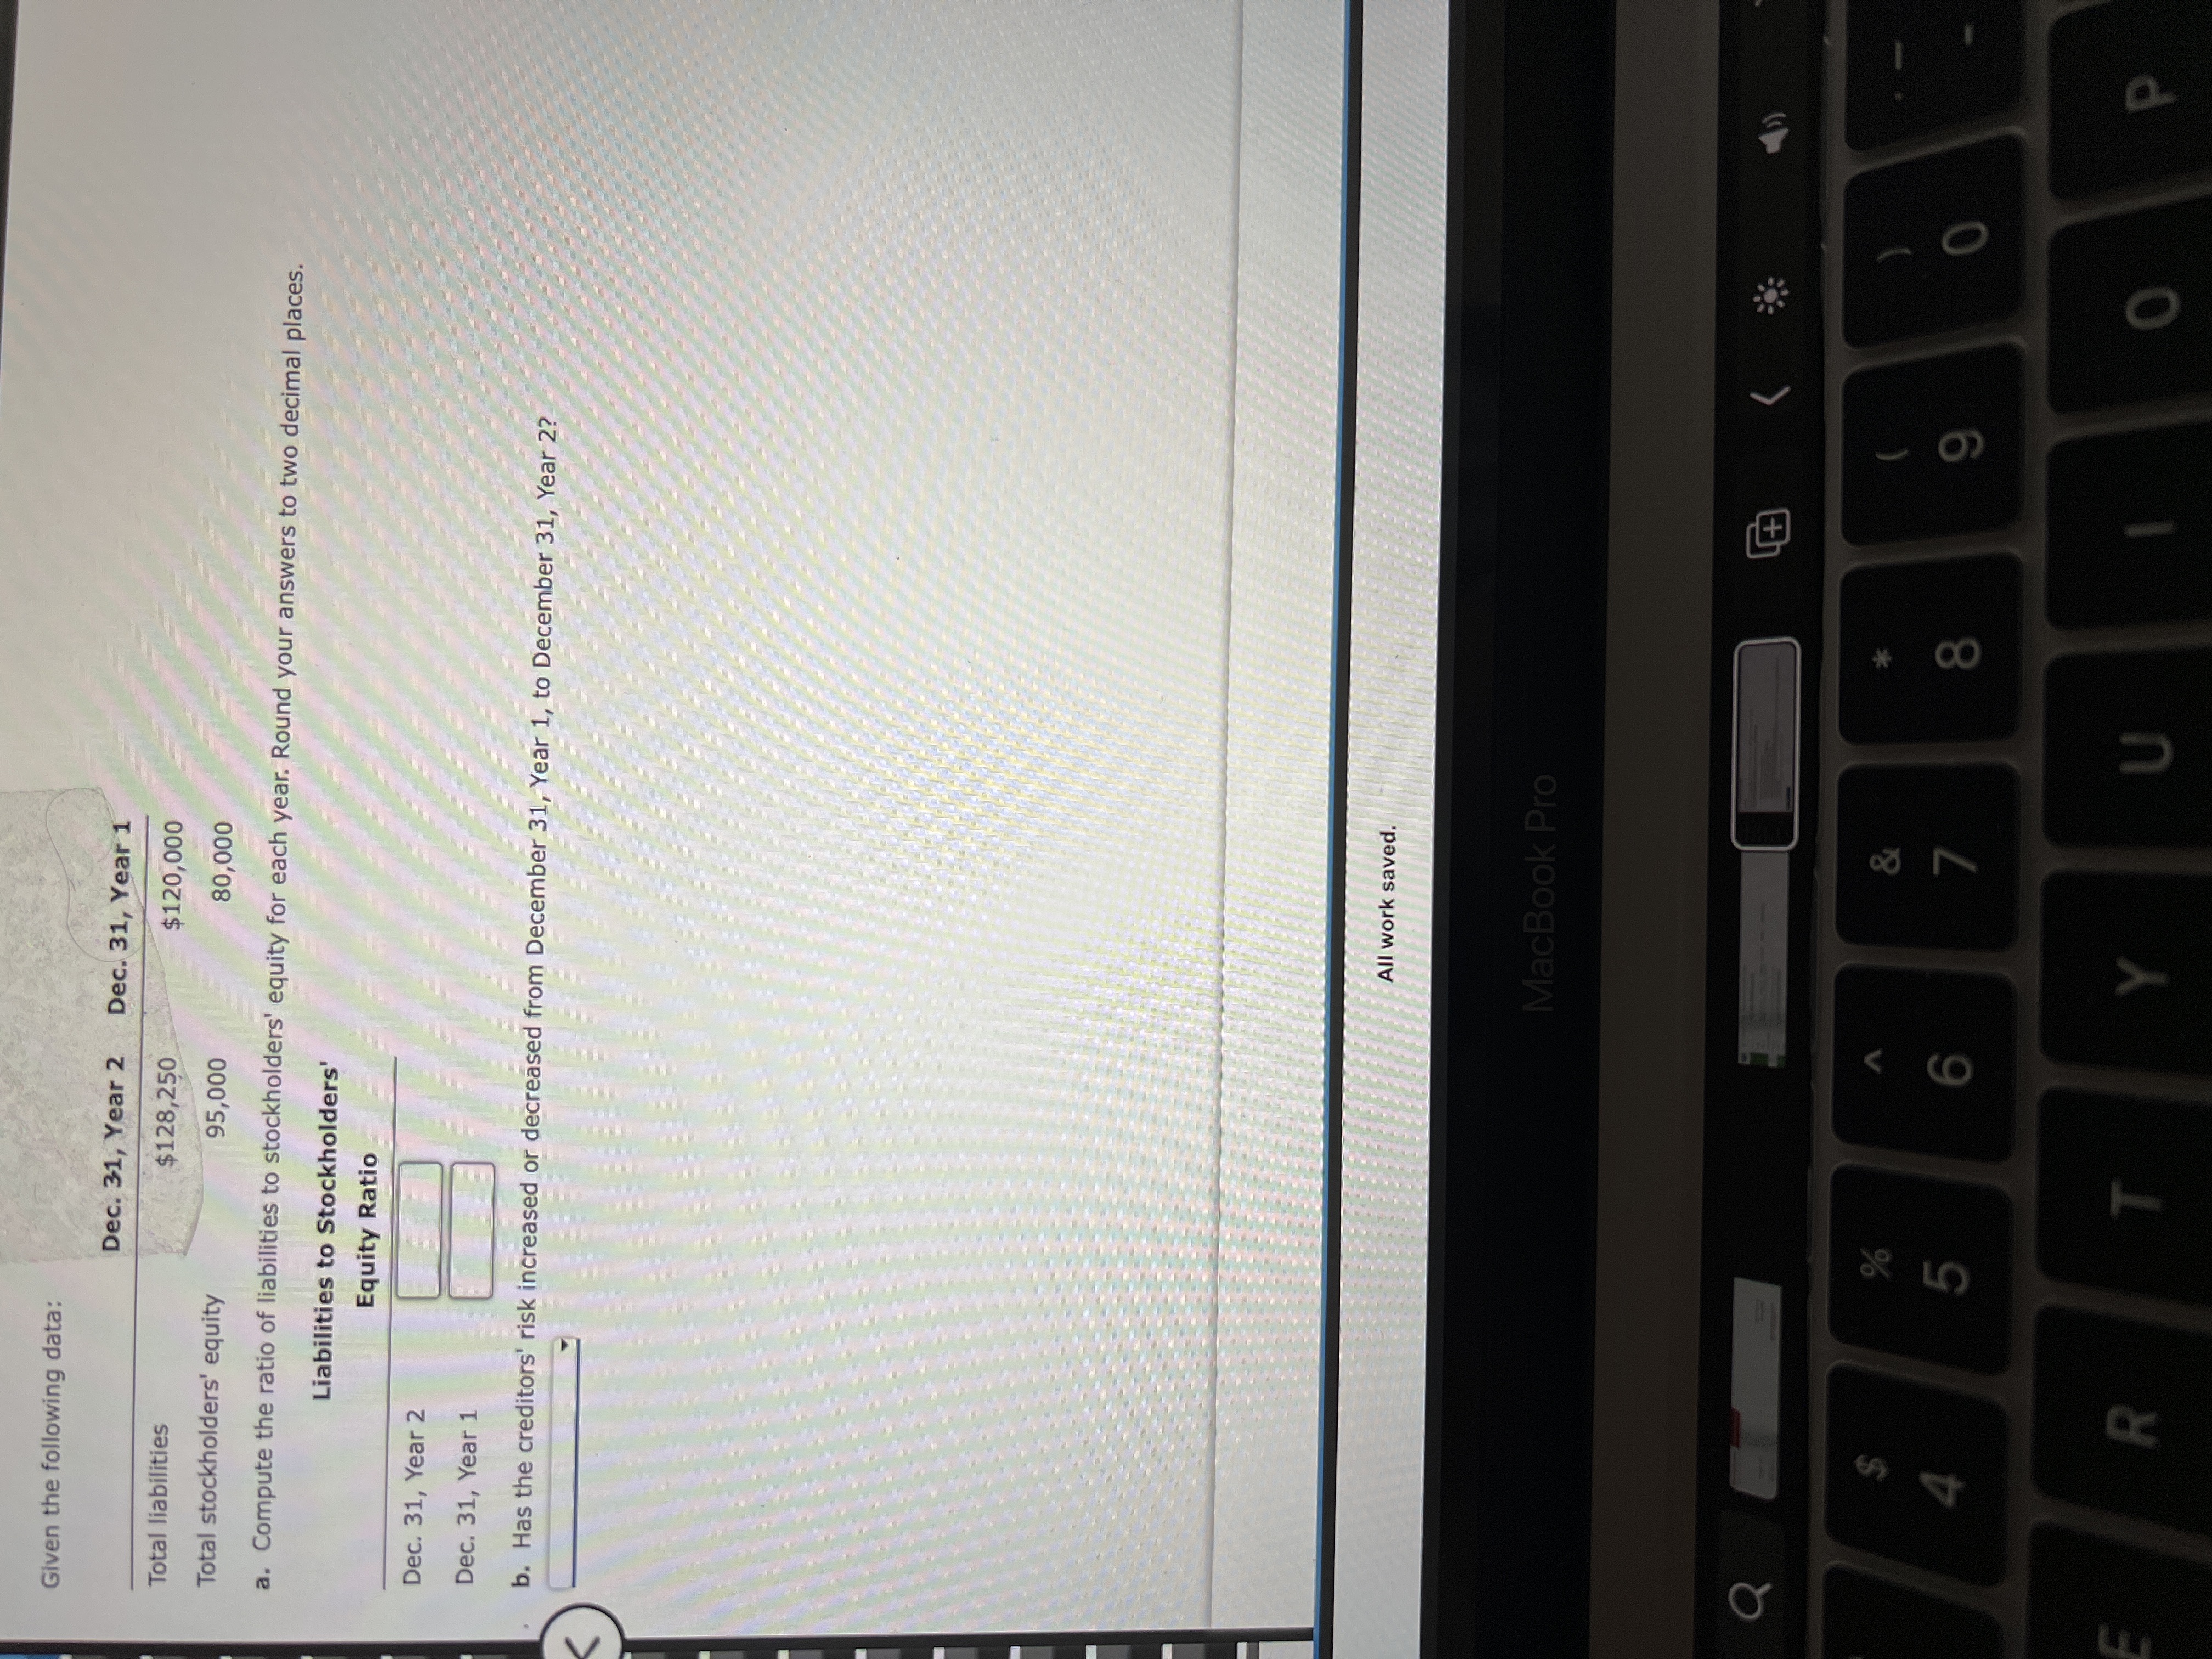
Given the following data:
Dec. 31, Year 2
Dec. 31, Year 1
Total liabilities
$128,250
$120,000
Total stockholders' equity
a. Compute the ratio of liabilities to stockholders' equity for each year. Round your answers to two decimal places.
Liabilities to Stockholders'
Equity Ratio
Dec. 31, Year 2
Dec. 31, Year 1
b. Has the creditors' risk increased or decreased from December 31, Year 1, to December 31, Year 2?
All work saved.
MacBook Pro
>
V
24
)
Expert Solution
This question has been solved!
Explore an expertly crafted, step-by-step solution for a thorough understanding of key concepts.

This is a popular solution

Trending nowThis is a popular solution!

Step by stepSolved in 2 steps

Knowledge Booster


Learn more about
Need a deep-dive on the concept behind this application? Look no further. Learn more about this topic, accounting and related others by exploring similar questions and additional content below.Similar questions
- Calculate debt to equity, long-term debt to equity and specify as a percent to 2 decimal placesarrow_forwardBankruptcy Risk and Z-Score Analysis Following are selected ratios for Logitech International SA for the company's 2019 fiscal year. Note: Complete the entire question in Excel and format each answer to two decimal places. Then enter the answers into the provided spaces below with two decimal places. in thousands (except price per share and shares outstanding) $1,350,436 EBIT $488,117 Total liabilities i Current assets Current liabilities Total assets $263,194 $576,494 $1,376,404 Sales revenue $1,896,059 Retained earnings $1,365,036 Shares outstanding 165,862,887 Price per share $39.34 Compute and interpret the Altman Z-score. Note: Convert shares outstanding to "in thousands" for your computation. Z-scorearrow_forwardItem Prior year Current year Accounts payable 8,109.00 7,758.00 Accounts receivable 6,059.00 6,782.00 Accruals 1,036.00 1,609.00 Cash ??? ??? Common Stock 11,891.00 11,189.00 COGS 12,683.00 18,018.00 Current portion long-term debt 4,980.00 4,993.00 Depreciation expense 2,500 2,813.00 Interest expense 733 417 Inventories 4,192.00 4,777.00 Long-term debt 13,329.00 13,523.00 Net fixed assets 50,636.00 54,376.00 Notes payable 4,329.00 9,999.00 Operating expenses (excl. depr.) 13,977 18,172 Retained earnings 28,278.00 29,801.00 Sales 35,119 47,221.00 Taxes 2,084 2,775 What is the firm's total change in cash from the prior year to the current year?arrow_forward
- Item Prior year Current year Accounts payable 8,194.00 7,893.00 Accounts receivable 6,066.00 6,786.00 Accruals 977.00 1,572.00 Cash ??? ??? Common Stock 11,869.00 12,264.00 COGS 12,616.00 18,108.00 Current portion long-term debt 5,038.00 5,064.00 Depreciation expense 2,500 2,825.00 Interest expense 733 417 Inventories 4,145.00 4,778.00 Long-term debt 13,680.00 14,055.00 Net fixed assets 50,966.00 54,551.00 Notes payable 4,331.00 9,956.00 Operating expenses (excl. depr.) 13,977 18,172 Retained earnings 28,104.00 29,983.00 Sales 35,119 45,456.00 Taxes 2,084 2,775 What is the firm's net income in the current year? . .arrow_forwardwhich of the below ratios can I use the attached file to calculate? return on total assets return on common stockholder's equity dividend payout ratio price-earnings ratioarrow_forwardItem Prior year Current year Accounts payable 8,109.00 7,758.00 Accounts receivable 6,059.00 6,782.00 Accruals 1,036.00 1,609.00 Cash ??? ??? Common Stock 11,891.00 11,189.00 COGS 12,683.00 18,018.00 Current portion long-term debt 4,980.00 4,993.00 Depreciation expense 2,500 2,813.00 Interest expense 733 417 Inventories 4,192.00 4,777.00 Long-term debt 13,329.00 13,523.00 Net fixed assets 50,636.00 54,376.00 Notes payable 4,329.00 9,999.00 Operating expenses (excl. depr.) 13,977 18,172 Retained earnings 28,278.00 29,801.00 Sales 35,119 47,221.00 Taxes 2,084 2,775 What is the firm's cash flow from investing?arrow_forward
- Need Answer with This Question please provide this onearrow_forwardBankruptcy Risk and Z-Score Analysis Following are selected ratios for Logitech International SA for the company's 2019 fiscal year. $ thousands (except per share numbers) Current assets Current liabilities Total assets Retained earnings Price per share Check $1,350,436 EBIT $717,819 Total liabilities Compute and interpret the Altman Z-score. Do not round computations until your final answer. Round answer to two decimal places. 4,268.91 x $263.194 $847.785 $2.024,124 Sales revenue $2.788,322 $1.365.036 Shares outstanding 165.852.887 $39.34arrow_forwardThe following information was drawn from the year-end balance sheets of Solomon River, Inc. Account Title Year 2 Year 1 Bonds $750,000 $1,005,000 payable Common stock 213,000 121,000 Treasury 27,500 5,500 stock Retained 62,200 88,900 earnings Additional information regarding transactions occurring during Year 2: 1. Solomon River, Inc. issued $42,300 of bonds during Year 2. The bonds were issued at face value. All bonds retired were retired at face value. 2. Common stock did not have a par value. 3. Solomon River, Inc. uses the cost method to account for treasury stock 4. The amount of net income shown on the Year 2 income statement was $32,700. Required a. Determine the amount of cash flow for the retirement of bonds that should appear on the Year 2 statement of cash flows. b. Determine the amount of cash flow from the issue of common stock that should appear on the Year 2 statement of cash flows. c. Determine the amount of cash flow for the purchase of treasury stock that should…arrow_forward
- Bankruptcy Risk and Z-Score Analysis Following are selected ratios for Logitech International SA for the company's 2019 fiscal year. Note: Complete the entire question in Excel and format each answer to two decimal places. Then enter the answers into the provided spaces below with two decimal places. in thousands (except price per share and shares outstanding) $1,350,436 EBIT $263,194 $509,651 Total liabilities $601,927 $1,979,709 165,862,887 Current assets Current liabilities Total assets Retained earnings Price per share $1,437,128 Sales revenue $1,365,036 Shares outstanding $39.34 Compute and interpret the Altman Z-score. Note: Convert shares outstanding to "in thousands" for your computation. Z-score Check 0arrow_forwardOn its Form 10-K for the year ended December 31, 2018, Bank of America Corp. reported information related to basic earnings per share.Fill in the missing information. Rounding instruction: Round answer a. to two decimal places.Round answer b., c., & d. to the nearest million.Round answer e. to one decimal place. $ millions, except per share amounts 2018 2017 2016 Net income $28,147 $18,232 d. Answer Preferred stock dividends 1,451 b. Answer $1,682 Net income applicable to common shareholders 26,696 c. Answer $16,140 Average common shares outstanding 10,096.5 10,195.6 e. Answer Basic earnings per share a. Answer $1.63 $1.57arrow_forwardAnnual and Average Returns for Stocks, Bonds, and T-Bills, 1950 to 2015 Stocks Long-Term Treasury Bonds T-bills 1950 to 2015 Average 12.6 % 6.6 % 4.40 % 1950 to 1959 Average 20.9 0.0 2.00 1960 to 1969 Average 8.7 1.6 4.00 1970 to 1979 Average 7.5 5.7 6.30 1980 to 1989 Average 18.2 13.5 8.90 1990 to 1999 Average 19.0 9.5 4.90 2000 to 2009 Average 0.9 8.0 2.70 2010 Annual Return 15.1 9.4 0.01 2011 Annual Return 2.1 29.9 0.02 2012 Annual Return 16.0 3.6 0.02 2013 Annual Return 32.4 −12.7 0.07 2014 Annual Return 13.7 25.1 0.05 2015 Annual Return 1.4 −1.2 0.21 2010 to 2015 Average 13.4 9.0 0.06 You have a portfolio with an asset allocation of 50 percent stocks, 40 percent long-term Treasury bonds, and 10 percent T-bills. Use these weights and the returns…arrow_forward
arrow_back_ios
arrow_forward_ios
Recommended textbooks for you
 AccountingAccountingISBN:9781337272094Author:WARREN, Carl S., Reeve, James M., Duchac, Jonathan E.Publisher:Cengage Learning,
 Accounting Information SystemsAccountingISBN:9781337619202Author:Hall, James A.Publisher:Cengage Learning,
 Horngren's Cost Accounting: A Managerial Emphasis...AccountingISBN:9780134475585Author:Srikant M. Datar, Madhav V. RajanPublisher:PEARSON
 Intermediate AccountingAccountingISBN:9781259722660Author:J. David Spiceland, Mark W. Nelson, Wayne M ThomasPublisher:McGraw-Hill Education
 Financial and Managerial AccountingAccountingISBN:9781259726705Author:John J Wild, Ken W. Shaw, Barbara Chiappetta Fundamental Accounting PrinciplesPublisher:McGraw-Hill Education
Accounting
Accounting
ISBN:9781337272094
Author:WARREN, Carl S., Reeve, James M., Duchac, Jonathan E.
Publisher:Cengage Learning,
Accounting Information Systems
Accounting
ISBN:9781337619202
Author:Hall, James A.
Publisher:Cengage Learning,
Horngren's Cost Accounting: A Managerial Emphasis...
Accounting
ISBN:9780134475585
Author:Srikant M. Datar, Madhav V. Rajan
Publisher:PEARSON
Intermediate Accounting
Accounting
ISBN:9781259722660
Author:J. David Spiceland, Mark W. Nelson, Wayne M Thomas
Publisher:McGraw-Hill Education
Financial and Managerial Accounting
Accounting
ISBN:9781259726705
Author:John J Wild, Ken W. Shaw, Barbara Chiappetta Fundamental Accounting Principles
Publisher:McGraw-Hill Education