
MATLAB: An Introduction with Applications
6th Edition
ISBN: 9781119256830
Author: Amos Gilat
Publisher: John Wiley & Sons Inc
expand_more
expand_more
format_list_bulleted
Related questions
Question
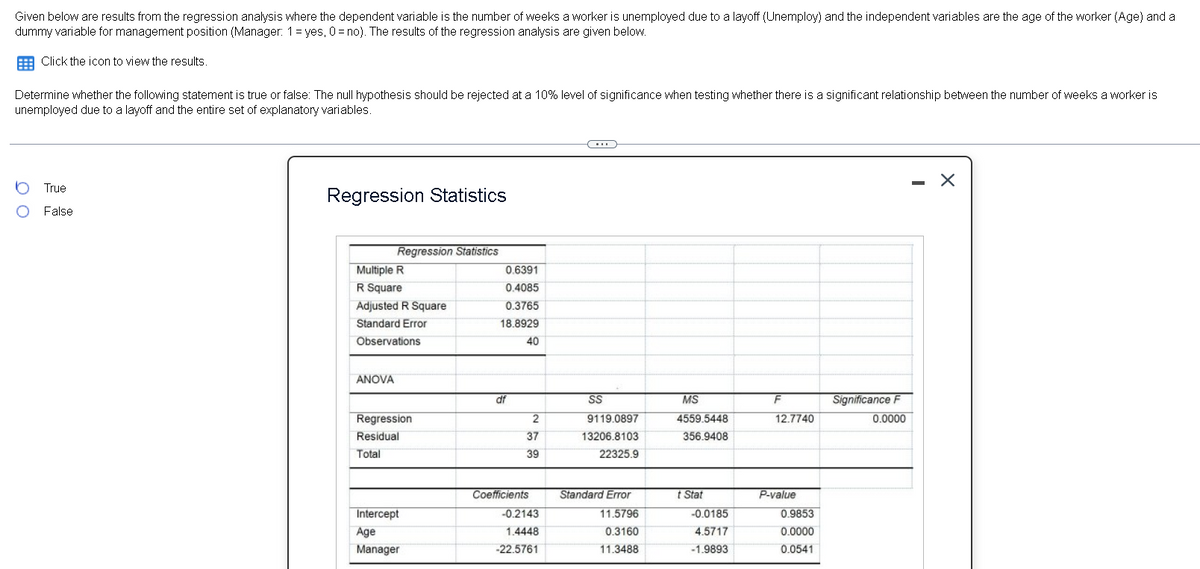

Transcribed Image Text:Given below are results from the regression analysis where the dependent variable is the number of weeks a worker is unemployed due to a layoff (Unemploy) and the independent variables are the age of the worker (Age) and a
dummy variable for management position (Manager: 1= yes, 0 = no). The results of the regression analysis are given below.
E Click the icon to view the results.
Determine whether the following statement is true or false: The null hypothesis should be rejected at a 10% level of significance when testing whether there is a significant relationship between the number of weeks a worker is
unemployed due to a layoff and the entire set of explanatory variables.
...
True
Regression Statistics
False
Regression Statistics
Multiple R
0.6391
R Square
0.4085
Adjusted R Square
0.3765
Standard Error
18.8929
Observations
40
ANOVA
df
MS
Significance F
Regression
2
9119.0897
4559.5448
12.7740
0.0000
Residual
37
13206.8103
356.9408
Total
39
22325.9
Coefficients
Standard Error
t Stat
P-value
Intercept
-0.2143
11.5796
-0.0185
0.9853
Age
1.4448
0.3160
4.5717
0.0000
Manager
-22.5761
11.3488
-1.9893
0.0541
Expert Solution
This question has been solved!
Explore an expertly crafted, step-by-step solution for a thorough understanding of key concepts.

This is a popular solution

Trending nowThis is a popular solution!

Step by stepSolved in 2 steps with 1 images

Knowledge Booster

Similar questions
- For a two-variable linear regression, if the sample correlation between the depen- dent and independent variables is –0.7, then the independent variable explains 49% of the variation in the dependent variable. Is this statement true? Explain your answer.arrow_forwardindlude answer(s) for part(s) A, B, C & D.arrow_forwardThe data in the table represent the number of licensed drivers in various age groups and the number of fatal accidents within the age group by gender. Complete parts (a) to (c) below. Click the icon to view the data table. C... (a) Find the least-squares regression line for males treating the number of licensed drivers as the explanatory variable, x, and the number of fatal crashes, y, as the response variable. Repeat this procedure for female Find the least-squares regression line for males. ŷ=0x+0 (Round the slope to three decimal places and round the constant to the nearest integer as needed.) Data for licensed drivers by age and gender. 21-24 25-34 35-44 45-54 55-64 65-74 > 74 Number of Male Fatal Licensed Age Drivers (000s) < 16 12 16-20 6,424 6,914 18,068 20,406 Number of Number of Female Fatal Crashes Licensed (Males) Drivers (000s) 227 12 6,139 Crashes (Females) 77 2,113 1,534 5,180 5,016 6,816 8,567 17,664 2,780 7,990 20,047 2,742 19,984 14,441 8,386 5,375 19,898 14,328 8,194…arrow_forward
- The equation of a regression line, unlike the correlation, depends on the units we use to measure the explanatory and response variables. Here is the data on percent body fat and preferred amount of salt. Preferred amountof salt x 0.2 0.3 0.4 0.5 0.6 0.8 1.1 Percent body fat y 20 31 22 29 39 22 30 In calculating the preferred amount of salt, the weight of the salt was in milligrams. (a) Find the equation of the regression line for predicting percent body fat from preferred amount of salt when weight is in milligrams. (Round your answers to one decimal place.) ŷ = ? + ? x (b) A mad scientist decides to measure weight in tenths of milligrams. The same data in these units are as follows. Preferred amountof salt x 2 3 4 5 6 8 11 Percent body fat y 20 31 22 29 39 22 30 Find the equation of the regression line for predicting percent body fat from preferred amount of salt when weight is in tenths of milligrams. (Round your intercept to one decimal place and your slope…arrow_forwardUsed cars 2010 Vehix.com offered several used ToyotaCorollas for sale. The following table displays the ages ofthe cars and the advertised prices. a) Make a scatterplot for these data.b) Do you think a linear model is appropriate? Explain.c) Find the equation of the regression line. d) Check the residuals to see if the conditions for infer-ence are met. Age (yr) Price ($) Age (yr) Price ($)1 15988 6 99951 13988 6 119882 14488 7 89903 10995 8 94883 13998 8 89954 13622 9 59904 12810 10 41005 9988 12 2995arrow_forwardThe personnel director of a large hospital is interested in determining the relationship (if any) between an employee's age and the number of sick days the employee takes per year. The director randomly selects ten employees and records their age and the number of sick days which they took in the previous year. Employee 1 2 3 4 5 6 7 8 Age 30 50 40 55 30 28 60 25 Sick Days 7 4 3 2 9 10 0 8 Copy Data The estimated regression line and the standard error are given. Sick Days = 14.310162 - 0.2369(Age 9 10 30 45 5 2 Se = 1.682207 Find the 95% confidence interval for the average number of sick days an employee will take per year, given the employee is 26. Round your answer to two decimal places.arrow_forward
arrow_back_ios
arrow_forward_ios
Recommended textbooks for you
- MATLAB: An Introduction with ApplicationsStatisticsISBN:9781119256830Author:Amos GilatPublisher:John Wiley & Sons Inc
 Probability and Statistics for Engineering and th...StatisticsISBN:9781305251809Author:Jay L. DevorePublisher:Cengage Learning
 Statistics for The Behavioral Sciences (MindTap C...StatisticsISBN:9781305504912Author:Frederick J Gravetter, Larry B. WallnauPublisher:Cengage Learning
  Elementary Statistics: Picturing the World (7th E...StatisticsISBN:9780134683416Author:Ron Larson, Betsy FarberPublisher:PEARSON
 The Basic Practice of StatisticsStatisticsISBN:9781319042578Author:David S. Moore, William I. Notz, Michael A. FlignerPublisher:W. H. Freeman
 Introduction to the Practice of StatisticsStatisticsISBN:9781319013387Author:David S. Moore, George P. McCabe, Bruce A. CraigPublisher:W. H. Freeman
MATLAB: An Introduction with Applications
Statistics
ISBN:9781119256830
Author:Amos Gilat
Publisher:John Wiley & Sons Inc
Probability and Statistics for Engineering and th...
Statistics
ISBN:9781305251809
Author:Jay L. Devore
Publisher:Cengage Learning
Statistics for The Behavioral Sciences (MindTap C...
Statistics
ISBN:9781305504912
Author:Frederick J Gravetter, Larry B. Wallnau
Publisher:Cengage Learning
Elementary Statistics: Picturing the World (7th E...
Statistics
ISBN:9780134683416
Author:Ron Larson, Betsy Farber
Publisher:PEARSON
The Basic Practice of Statistics
Statistics
ISBN:9781319042578
Author:David S. Moore, William I. Notz, Michael A. Fligner
Publisher:W. H. Freeman
Introduction to the Practice of Statistics
Statistics
ISBN:9781319013387
Author:David S. Moore, George P. McCabe, Bruce A. Craig
Publisher:W. H. Freeman