Financial Reporting, Financial Statement Analysis and Valuation
8th Edition
ISBN: 9781285190907
Author: James M. Wahlen, Stephen P. Baginski, Mark Bradshaw
Publisher: Cengage Learning
expand_more
expand_more
format_list_bulleted
Question

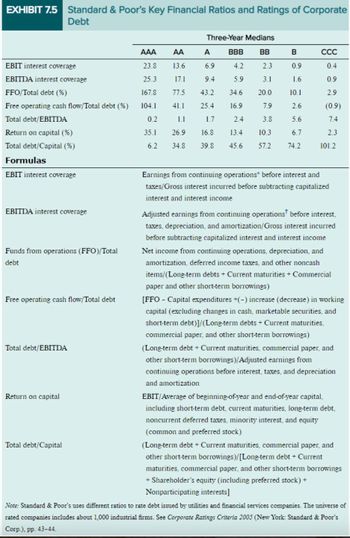
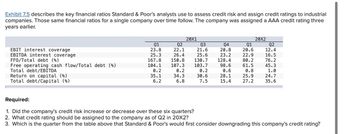
Transcribed Image Text:Exhibit 7.5 describes the key financial ratios Standard & Poor's analysts use to assess credit risk and assign credit ratings to industrial
companies. Those same financial ratios for a single company over time follow. The company was assigned a AAA credit rating three
years earlier.
20X1
20X2
Q1
Q2
Q3
Q4
Q1
Q2
EBIT interest coverage
23.8
22.1
21.6
20.8
20.6
12.4
EBITDA interest coverage
25.3
26.4
25.6
23.2
22.9
16.5
FFO/Total debt (%)
167.8
150.8
130.7
128.4
80.2
76.2
Free operating cash flow/Total debt (%)
104.1
107.3
103.7
98.6
61.5
45.3
Total debt/EBITDA
0.2
0.2
0.2
0.6
0.8
1.0
Return on capital (%)
Total debt/Capital (%)
35.1
6.2
34.3
30.6
28.1
25.9
24.7
6.8
7.5
15.4
27.2
35.6
Required:
1. Did the company's credit risk increase or decrease over these six quarters?
2. What credit rating should be assigned to the company as of Q2 in 20X2?
3. Which is the quarter from the table above that Standard & Poor's would first consider downgrading this company's credit rating?
Expert Solution
This question has been solved!
Explore an expertly crafted, step-by-step solution for a thorough understanding of key concepts.
Step by stepSolved in 2 steps

Knowledge Booster
Similar questions
- Exhibit 7.5 describes the key financial ratios Standard & Poor’s analysts use to assess credit risk and assign credit ratings to industrial companies. The same financial ratios for three firms follow. Firm 1 Firm 2 Firm 3 EBIT interest coverage 2.7 12.8 16.7 EBITDA interest coverage 3.7 18.7 24.6 FFO/Total debt (%) 19.8 80.2 135.1 Free operating cash flow/Total debt (%) 8.2 40.6 87.9 Total debt/EBITDA 4.0 1.0 0.3 Return on capital (%) 9.9 29.2 32.7 Total debt/Capital (%) 54.8 30.2 8.1 Required: What credit rating would be assigned to Firm 1? What credit rating would be assigned to Firm 2? Does Firm 3 have more or less credit risk than Firm 2? EXHIBIT7.5arrow_forwardUse the financial ratios of company A and company B to answer the questions below. Company A Company B Yr t+1 Year t Yr t+1 Year t Current ratio 0.55 0.59 0.56 0.55 Accounts receivable turnover 6.22 6.25 5.06 4.87 Debt to total assets 40.5% 40% 67.8% 65.9% Times interest earned 8.80 30.6 5.97 6.33 Free cash flows (in millions) ($3,819) $3,173 $168 $550 Return on stockholders’equity 7.7% 7.7% 26.6% 23.3% Return on assets 4.3% 4.3% 8.9% 7.9% Profit margin…arrow_forwardMethodology:• Based on the above information the consulting group will conduct ratio analysis for the following ratios:o Current ratio o Receivable’s turnover o Times’s interest earned o Profit margin o Days in inventory o Return on assets o Cash current debt coverage ratio • As a next step the group will compare the ratios calculated above with industry benchmarks. The benchmarks are indicated within brackets besides each ratio.o Current ratio (3 to 1) o Receivable’s turnover (13 times) o Times’s interest earned (9 times) o Profit margin (12%) o Days in inventory (50 days) o Return on assets (12%) o Cash current debt coverage ratio (2 timesarrow_forward
- please help me answeer the following given Debt analysis Springfield Bank is evaluating Creek Enterprises, which has requested a $3,780,000 loan, to assess the firm's financial leverage and financial risk. On the basis of the debt ratios for Creek, along with the industr, averages and Creek's recent financial statements, evaluate and recommend appropriate action on the loan request. Industry averages Creek Enterprises Income Statement: Debt ratio 0 50 Times interest earned ratio 7.42 Fixed-payment coverage ratio 2.03 Creek Enterprises Balance Sheet: Creek Enterprises's debt ratio is _____ (Round to two decimal places.) Creek Enterprises's times interest earned ratio is ______ (Round to two decimal places.) Creek Enterprises's fixed-payment coverage ratio is. ______ (Round to two decimal places.) Complete the following summary of ratios and compare Creek Enterprises's ratios vs. the industry average: (Round to two decimal places.) Creek Debt ratio Industry 0.50 Times…arrow_forwardCalculating and Interpreting Risk Ratios. Refer to the financial statement data for Hasbro in Problem 4.24 in Chapter 4. Exhibit 5.15 presents risk ratios for Hasbro for Year 2 and Year 3. Exhibit 5.15 REQUIRED a. Calculate the amounts of these ratios for Year 4. b. Assess the changes in the short-term liquidity risk of Hasbro between Year 2 and Year 4 and the level of that risk at the end of Year 4. c. Assess the changes in the long-term solvency risk of Hasbro between Year 2 and Year 4 and the level of that risk at the end of Year 4.arrow_forwardRatios Analyses: McCormick Refer to the information for McCormick above. Additional information for 20X3 it as follows (amounts in millions): Required: Next Level Compute the following for 20X3. Provide a brief description of what each ratio reveals about McCormick 1. return on common equity 2. debt-to-assets 3. debt-toequity 4. current 5. quick (McCormick uses cash and equivalents, short-term securities and receivables in their quick ratio calculation.) 6. inventory turnover days 7. accounts receivable turnover days 8. accounts payable turnover days 9. operating cycle (in days) 10. total asset turnover Use the following information for 14-17 and 14-18: The Hershey Company is one of the worlds leading producers of chocolates, candies, and confections. It sells chocolates and candies, mints and gums, baking ingredients, toppings, and beverages. Hersheys consolidated balance sheets for 20X2 and 20X3 follow.arrow_forward
- Integrative: Complete ratio analysis Given the following financial statements E, historical ratios, and industry averages , calculate Sterling Company's financial ratios for the most recent year. (Assume a 365-day year.) Analyze its overall financial situation from both a cross-sectional and a time-series viewpoint. Break your analysis into evaluations of the firm's liquidity, activity, debt, profitability, and market. The current ratio is 1.59. (Round to two decimal places.) Data table Time-series analysis of the current ratio: Improving (Select from the drop-down menu.) Cross-sectional analysis of the current ratio: Poor (Select from the drop-down menu.) (Click the icon here O in order to copy the contents of the data table below into a spreadsheet.) The quick ratio is 0.84. (Round to two decimal places.) Historical and Industry Average Ratios for Sterling Company Ratio Actual 2020 Actual 2021 Industry average, 2022 Time-series analysis of the quick ratio: (Select from the drop-down…arrow_forwardRATIO ANALYSIS. Debt Ratio Activity 6 · Understand the information provided by the debt ratio. · Identify the expected range and whether an increasing or decreasing trend is preferred. Purpose: The debt ratio compares total liabilities to total assets. This ratio measures the proportion of assets financed by debt. It is a measure of long-term solvency. Total liabilities DEBT RATI0 = Total assets JOHNSON & CITIGROUP 12/31/99 HEWLETT- PACKARD 10/3 1/99 JOHNSON 1/03/99 WAL-MART 1/31/99 ($ in 000s) Assets $716,937,000 $35,297,000 $26,211,000 $49,996,000 Liabilities 667,251,000 17,002,000 12,621.000 28,884,000 Stockholders' Equity $ 49,686,000 $18,295,000 $13,590,000 $21,112,000 Source: Disclosure, Inc, Compact D/SEC, 2000. 1. For each-company listed above, compute the debt ratio. Record your results below. Debt ratio: 0.93 2. The debt ratios computed above are primarily in the ranġe (less than 0,40 / 0.40 through 0.70 / over 0.70): 3. % of Wal-Mart's assets are financed by debt. 4.…arrow_forwardWhat is the overall assement of the company's credit risk (explain)? Is there any difference between the two years?arrow_forward
- KINDLY ANSWER PARTS IV & V FOLLOWED BY PART B.i,ii,iiiarrow_forwardRequirement 1. Compute the following ratios for both companies for the current year, and decide which company’s stock better fits your investment strategy. a. Acid-test ratio b. Inventory turnover c. Days’ sales in receivables d. Debt ratio e. Earnings per share of common stock f. Price/earnings ratio g. Dividend payoutarrow_forward36 Ratio Analysis - Explain how the following ratios are calculated and what the ratio indicates. Include how these ratios provide useful information related to accounting decision making topics such as efficiency (collecting amounts owed to the firm, using the assets well, getting items to market, etc.), liquidity (ability to pay current debts), solvency (ability to pay long term or all debts) Asset Turnover Return on Assets Current Ratio Accounts Receivable Turnover Average Collection Period Debt Ratio Days’ sales in Inventory Gross Profit Percentage Return on Sales Ratioarrow_forward
arrow_back_ios
SEE MORE QUESTIONS
arrow_forward_ios
Recommended textbooks for you
 Financial Reporting, Financial Statement Analysis...FinanceISBN:9781285190907Author:James M. Wahlen, Stephen P. Baginski, Mark BradshawPublisher:Cengage Learning
 Intermediate Accounting: Reporting And AnalysisAccountingISBN:9781337788281Author:James M. Wahlen, Jefferson P. Jones, Donald PagachPublisher:Cengage Learning

Financial Reporting, Financial Statement Analysis...
Finance
ISBN:9781285190907
Author:James M. Wahlen, Stephen P. Baginski, Mark Bradshaw
Publisher:Cengage Learning

Intermediate Accounting: Reporting And Analysis
Accounting
ISBN:9781337788281
Author:James M. Wahlen, Jefferson P. Jones, Donald Pagach
Publisher:Cengage Learning