
Survey of Accounting (Accounting I)
8th Edition
ISBN: 9781305961883
Author: Carl Warren
Publisher: Cengage Learning
expand_more
expand_more
format_list_bulleted
Related questions
Question
Find the Common Size Analysis for three years for the Income Statement of Excel Corporation.
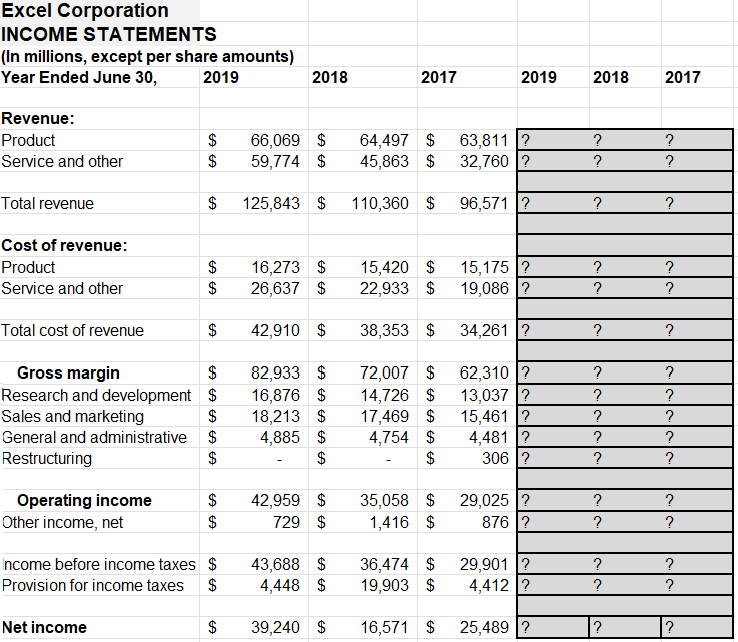

Transcribed Image Text:Excel Corporation
INCOME STATEMENTS
(In millions, except per share amounts)
Year Ended June 30,
2019
2018
2017
2019
2018
2017
Revenue:
Product
$
66,069 $
64,497 $
63,811 ?
?
?
Service and other
$
59,774 $
45,863 $
32,760 ?
?
?
Total revenue
EA
$
125,843 $
110,360 $
96,571 ?
?
?
Cost of revenue:
Product
$
16,273 $
15,420 $
15,175 ?
?
?
Service and other
$
26,637 $
22,933 $
19,086 ?
?
?
Total cost of revenue
$
42,910 $
38,353 $
34,261 ?
?
?
Gross margin
$
82,933 $
72,007 $
62,310 ?
?
?
Research and development $
16,876 $
14,726 $
13,037 ?
?
?
Sales and marketing
$
18,213 $
17,469 $
15,461
?
?
?
General and administrative $
4,885 $
4,754 $
4,481 ?
?
?
Restructuring
$
$
$
306 ?
?
?
Operating income
42,959
$
35,058 $
29,025 ?
?
?
Other income, net
$
729 $
1,416 $
876?
?
?
Income before income taxes $
43,688 $
36,474 $
29,901 ?
?
?
Provision for income taxes
$
4,448 $
19,903 $
4,412 ?
?
?
Net income
$
39,240 $
16,571 $
25,489 ?
?
?
SAVE
AI-Generated Solution
info
AI-generated content may present inaccurate or offensive content that does not represent bartleby’s views.
Unlock instant AI solutions
Tap the button
to generate a solution
to generate a solution
Click the button to generate
a solution
a solution
Knowledge Booster

Similar questions
- What is the return on sales for fiscal year 2019 2018?arrow_forwardPreparation of Ratios The financial statements for Venus Industries follow: Venus IndustriesConsolidated Income Statements(in thousands, except per share data) Year ended December 31, 2023 2022 2021 Revenues $4,578,041 $3,864,324 $3,003,610 Costs and expenses: Cost of goods sold $2,227,189 $2,089,089 $2,005,691 Selling and administrative 922,261 836,212 664,061 Interest 29,744 32,966 30,472 Other expenses (income) 1,475 2,141 (43) Total costs and expenses $3,180,669 $2,960,408 $2,700,181 Income before income taxes $1,397,372 $903,916 $303,429 Income taxes 229,500 192,600 174,700 Net income $1,167,872 $711,316 $128,729 Venus IndustriesConsolidated Balance Sheets (in thousands) December 31, ASSETS 2023 2022 Current assets: Cash and equivalents $291,284 $260,050 Accounts receivable, less allowance for doubtful accounts of $19,447 and $20,046 807,530 596,018 Inventories 592,986 512,917 Deferred income taxes 26,378 28,355…arrow_forwardPreparing Common Size Statements The financial statements for Venus Industries follow: Venus IndustriesConsolidated Income Statements(in thousands, except per share data) Year ended December 31, 2023 2022 2021 Revenues $4,578,041 $3,864,324 $3,003,610 Costs and expenses: Cost of goods sold $2,227,189 $2,089,089 $2,005,691 Selling and administrative 922,261 836,212 664,061 Interest 29,744 32,966 30,472 Other expenses (income) 1,475 2,141 (43) Total costs and expenses $3,180,669 $2,960,408 $2,700,181 Income before income taxes $1,397,372 $903,916 $303,429 Income taxes 229,500 192,600 174,700 Net income $1,167,872 $711,316 $128,729 Venus IndustriesConsolidated Balance Sheets (in thousands) December 31, ASSETS 2023 2022 Current assets: Cash and equivalents $291,284 $260,050 Accounts receivable, less allowance for doubtful accounts of $19,447 and $20,046 826,977 616,064 Inventories 592,986 512,917 Deferred income taxes 26,378…arrow_forward
- Global Corp. initially projected the 2019 income statement shown in the table E. Suppose that in 2019, Global launched an aggressive marketing campaign that boosted 2019 sales further by 14.1%. However, their operating margin fell from 5.56% to 4.49% Suppose that they had no other income, interest expenses were unchanged, and taxes were the same percentage of pretax income (26%) as in 2018. a. What was Global's EBIT in 2019? b. What was Global's income in 2019? c. If Global's P/E ratio (18.0) and number of shares outstanding (3.6 million) remained unchanged, what was Global's share price in 2019? a. What was Global's EBIT in 2019? Global's EBIT was $ million. (Round to two decimal places.) b. What was Global's income in 2019? Net income was $ million. (Round to two decimal places.) c. If Global's P/E ratio (18.0) and number of shares outstanding (3.6 million) remained unchanged, what was Global's share price in 2019? Global's share price in 2019 was $. (Round to the nearest cent.)arrow_forwardfind P/E Ratio 2019. i attached balance sheet and income statementarrow_forwardEstimating Share Value Using the ROPI Model Following are forecasts of sales, net operating profit after tax (NOPAT), and net operating assets (NOA) as of December 31, 2018, for Humana. Terminal Note: Complete the entire question in Excel and format each answer to two decimal places. Then enter the answers into the provided spaces below with two decimal place Reported Horizon period $ millions 2018 2019 2020 2021 2022 Period Sales $56,880 $57,734 $58,600 $59,480 $60,372 2,492 2,542 2,580 2.619 2,658 4,000 4,065 4,126 4,189 4,252 NOPAT NOA $60,976 2,684 4,295 Answer the following requirements with the following assumptions: Assumptions Terminal period growth rate Discount rate (WACC) 19 7.8% Common shares outstanding 135.6 million Net nonoperating obligations (NNO) S(6,161) million NNO is negative because Humana's nonoperating assets exceed its nonoperating liabilities. (a) Estimate the value of a share of common stock using the residual operating income (ROPI) model as of December 31,…arrow_forward
- NETFLIX, INC. CONSOLIDATED STATEMENTS OF OPERATIONS (in thousands, except per share data) Year ended December 31, 2018 15,794,341 9,967,538 2020 2019 20,156,447 S Revenues 24,996,056 $ Cost of revenues 15,276,319 2,228,362 12,440,213 Marketing 2,652,462 2,369,469 1,221,814 Technology and development General and administrative Oper. expenjes 1.829,600 1,545,149 914,369 1,076,486 630,294 Operating income Other income (expense): Interest expense Interest and other income (expense) 4,585,289 2,604,254 1,605,226 (767,499) (618,441) 3,199,349 (626,023) 84,000 (420,493) 41,725 Income before income taxes 2,062,231 (195,315) 1,866,916 S 1,226,458 Provision for income taxes (437,954) 2,761,395 S (15,216) 1,211,242 Net income Earnings per share: Basie 6.26 $ 4.26 $ 2.78 Diluted 6.08 S 4.13 $ 2.68 Weighted-average common shares outstanding: Basic 440,922 437,799 435,374 Diluted 454,208 451,765 451,244 See accompanying notes to consolidated financial statements. 42 TO calcalate "other expensis"…arrow_forwardEstimating Share Value Using the ROPI Model Following are forecasts of sales, net operating profit after tax (NOPAT), and net operating assets (NOA) as of December 31, 2018, for Humana. Note: Complete the entire question in Excel and format each answer to two decimal places. Then enter the answers into the provided spaces below with two decimal places. Reported Horizon period Terminal millions Sales NOPAT NOA 2018 2019 2020 2021 2022 $56,912 $57,766 $58,632 $59,512 $60,404 2,492 2,542 2,580 2,619 2,658 4,097 4,158 4,221 4,284 4,032 Answer the following requirements with the following assumptions: Assumptions Terminal period growth rate 1% Discount rate (WACC) 7.8% Common shares outstanding 135.6 million Net nonoperating obligations (NNO) $(6,129) million ($ millions) ROPI (NOPAT- [NOABeg x rw]) Present value of horizon ROPI Cum present value of horizon ROPI $ Present value of terminal ROPI NOA Total firm value Less NNO Firm equity value Shares outstanding (millions) Stock price per…arrow_forwardQuestion Content Area Debt Management Ratios Financial statements for Steele Inc. follow. Steele Inc. Consolidated Income Statements (in thousands except per share amounts) 2023 2022 2021 Net sales $7,245,088 $6,944,296 $6,149,218 Cost of goods sold (5,286,253) (4,953,556) (4,355,675) Gross margin $1,958,835 $1,990,740 $1,793,543 General and administrative expenses (1,259,896) (1,202,042) (1,080,843) Special and nonrecurring items 2,617 0 0 Operating income $701,556 $788,698 $712,700 Interest expense (63,685) (62,398) (63,927) Other income 7,308 10,080 11,529 Gain on sale of investments 0 9,117 0 Income before income taxes $645,179 $745,497 $660,302 Provision for income taxes (254,000) (290,000) (257,000) Net income $391,179 $455,497 $403,302 Steele Inc. Consolidated Balance Sheets (in thousands) ASSETS Dec. 31, 2023 Dec. 31, 2022 Current assets: Cash and…arrow_forward
- return on Assets Sue Company reports the following information in its financial statements. Numbers are in thousands. 2019 2018Net Sales $42,075 $44,100Net Income 12,780 15,732Total Assets 63,900 87,400 There were 5,000 outstanding shares at December 31, 2019.Required a. What was Sue's return on assets for 2019 and 2019? (Round to one decimal point)arrow_forwardSteele Inc. Consolidated Statements of Income (in thousands except per share amounts) 2023 2022 2021 Net sales $7,245,088 $6,944,296 $6,149,218 Cost of goods sold (5,286,253) (4,953,556) (4,355,675) Gross margin $1,958,835 $1,990,740 $1,793,543 General and administrative expenses (1,259,896) (1,202,042) (1,080,843) Special and nonrecurring items 2,617 0 0 Operating income $701,556 $788,698 $712,700 Interest expense (63,685) (62,398) (63,927) Other income 7,308 10,080 11,529 Gain on sale of investments 0 9,117 0 Income before income taxes $645,179 $745,497 $660,302 Provision for income taxes 254,000 290,000 257,000 Net income $391,179 $455,497 $403,302 Steele Inc. Consolidated Balance Sheets (in thousands) ASSETS Dec. 31, 2023 Dec. 31, 2022 Current assets: Cash and equivalents $320,558 $41,235 Accounts receivable 1,056,911 837,377 Inventories 733,700…arrow_forwardSome selected financial statement items belonging to MNO Company are given in the table below. According to this information, which of the following is Return on Assets (ROA) in 2021? Inventory 12,500Total Assets in 2021 110,000Current Liabilities 40,000Total Assets in 2020 90,000Net Profit 12,000Shareholders' Equity 65,000 Select one:a. 0.12b. 0.10c. 0.18d. 0.13arrow_forward
arrow_back_ios
SEE MORE QUESTIONS
arrow_forward_ios
Recommended textbooks for you
- Survey of Accounting (Accounting I)AccountingISBN:9781305961883Author:Carl WarrenPublisher:Cengage Learning
 Intermediate Accounting: Reporting And AnalysisAccountingISBN:9781337788281Author:James M. Wahlen, Jefferson P. Jones, Donald PagachPublisher:Cengage Learning
 Cornerstones of Financial AccountingAccountingISBN:9781337690881Author:Jay Rich, Jeff JonesPublisher:Cengage Learning
  Fundamentals Of Financial Management, Concise Edi...FinanceISBN:9781337902571Author:Eugene F. Brigham, Joel F. HoustonPublisher:Cengage Learning
 Financial And Managerial AccountingAccountingISBN:9781337902663Author:WARREN, Carl S.Publisher:Cengage Learning,
 Financial & Managerial AccountingAccountingISBN:9781285866307Author:Carl Warren, James M. Reeve, Jonathan DuchacPublisher:Cengage Learning
Survey of Accounting (Accounting I)
Accounting
ISBN:9781305961883
Author:Carl Warren
Publisher:Cengage Learning
Intermediate Accounting: Reporting And Analysis
Accounting
ISBN:9781337788281
Author:James M. Wahlen, Jefferson P. Jones, Donald Pagach
Publisher:Cengage Learning
Cornerstones of Financial Accounting
Accounting
ISBN:9781337690881
Author:Jay Rich, Jeff Jones
Publisher:Cengage Learning
Fundamentals Of Financial Management, Concise Edi...
Finance
ISBN:9781337902571
Author:Eugene F. Brigham, Joel F. Houston
Publisher:Cengage Learning
Financial And Managerial Accounting
Accounting
ISBN:9781337902663
Author:WARREN, Carl S.
Publisher:Cengage Learning,
Financial & Managerial Accounting
Accounting
ISBN:9781285866307
Author:Carl Warren, James M. Reeve, Jonathan Duchac
Publisher:Cengage Learning