
ENGR.ECONOMIC ANALYSIS
14th Edition
ISBN: 9780190931919
Author: NEWNAN
Publisher: Oxford University Press
expand_more
expand_more
format_list_bulleted
Related questions
Question

Transcribed Image Text:11/17/21, 2:00 AM
Data Table
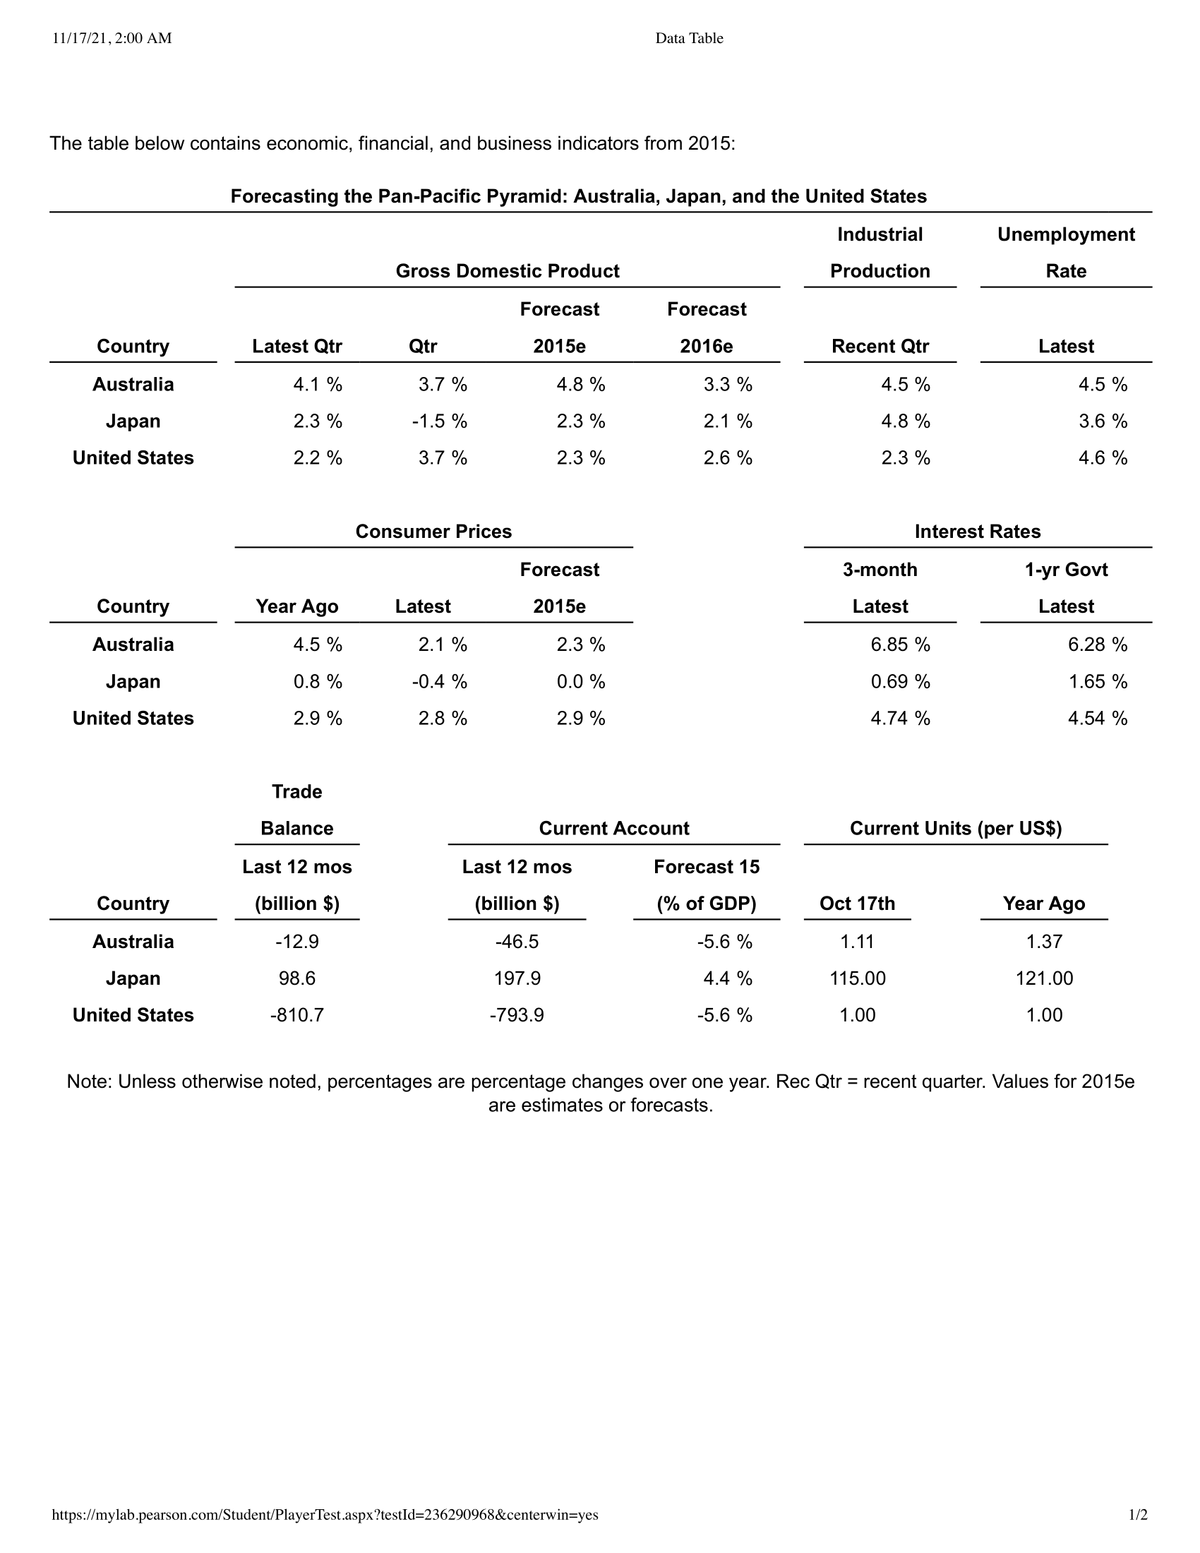
The table below contains economic, financial, and business indicators from 2015:
Forecasting the Pan-Pacific Pyramid: Australia, Japan, and the United States
Industrial
Unemployment
Gross Domestic Product
Production
Rate
Forecast
Forecast
Country
Latest Qtr
Qtr
2015e
2016e
Recent Qtr
Latest
Australia
4.1 %
3.7 %
4.8 %
3.3 %
4.5 %
4.5 %
Jаpan
2.3 %
-1.5 %
2.3 %
2.1 %
4.8 %
3.6 %
United States
2.2 %
3.7 %
2.3 %
2.6 %
2.3 %
4.6 %
Consumer Prices
Interest Rates
Forecast
3-month
1-yr Govt
Country
Year Ago
Latest
2015e
Latest
Latest
Australia
4.5 %
2.1 %
2.3 %
6.85 %
6.28 %
Japan
0.8 %
-0.4 %
0.0 %
0.69 %
1.65 %
United States
2.9 %
2.8 %
2.9 %
4.74 %
4.54 %
Trade
Balance
Current Account
Current Units (per US$)
Last 12 moS
Last 12 mos
Forecast 15
Country
(billion $)
(billion $)
(% of GDP)
Oct 17th
Year Ago
Australia
-12.9
-46.5
-5.6 %
1.11
1.37
Japan
98.6
197.9
4.4 %
115.00
121.00
United States
-810.7
-793.9
-5.6 %
1.00
1.00
Note: Unless otherwise noted, percentages are percentage changes over one year. Rec Qtr = recent quarter. Values for 2015e
are estimates or forecasts.
https://mylab.pearson.com/Student/PlayerTest.aspx?testId=236290968¢erwin=yes
1/2

Transcribed Image Text:Purchasing Power Parity Forecasts. Use the table
Assuming purchasing power parity, and assuming that the forecasted change in consumer prices is a good proxy of predicted inflation, forecast the following
exchange rates:
a. Japanese yen/U.S. dollar in one year
b. Japanese yen/Australian dollar in one year
c. Australian dollar/U.S. dollar in one year
|containing economic, financial, and business indicators to answer the following questions.
Assuming purchasing power parity, and assuming that the forecasted change in consumer prices is a good proxy of predicted inflation, forecast the following
exchange rates:
a. Japanese yen/U.S. dollar in one year
The forecast of the spot rate for Japanese yen/U.S. dollar in one year is Y/s. (Round to two decimal places.)
b. Japanese yen/Australian dollar in one year
The forecast of the cross rate for Japanese yen/Australian dollar in one year is ¥A$. (Round to two decimal places.)
c. Australian dollar/U.S. dollar in one year
The forecast of the spot rate for Australian dollar/U.S. dollar in one year is A$ $. (Round to four decimal places.)
Expert Solution
This question has been solved!
Explore an expertly crafted, step-by-step solution for a thorough understanding of key concepts.

This is a popular solution

Trending nowThis is a popular solution!

Step by stepSolved in 2 steps

Knowledge Booster


Learn more about
Need a deep-dive on the concept behind this application? Look no further. Learn more about this topic, economics and related others by exploring similar questions and additional content below.Similar questions
- What does this graph show below:arrow_forwardBelow are some employment data from the country Commagene. 2018 2019 2020 Number of Employed Number of Unemployed Number of Out of Labor Force Unemployment rate Labor Force Participation rate 99 110 63 30 330 217 70 30% y 50% a) Using the information given in the table for year 2018, find the values of x and y. b) Using the information given in the table for year 2019, find the values of z and w. c) Using the information given in the table for year 2020, find the values of p and r.arrow_forward| containing economic, financial, and business indicators to answer the following questions. Assuming International Fischer Forecasts. Use the table International Fischer-one version of Purchasing Power Parity-applies to the coming year, forecast the following future spot exchange rates using the government bond rates for the respective country currencies: a. Japanese yen/U.S. dollar in one year b. Japanese yen/Australian dollar in one year c. Australian dollar/U.S. dollar in one year ..... Assuming International Fischer-one version of Purchasing Power Parity-applies to the coming year, forecast the following future spot exchange rates using the government bond rates for the respective country currencies: a. Japanese yen/U.S. dollar in one year The future spot exchange rate for Japanese yen/U.S. dollar in one year is ¥S. (Round to two decimal places.)arrow_forward
- Please answer all partsarrow_forward2021 - Find economic indicators St. Louis federal reserve website. look up current economic indicators from GDP, inflation, economic growth put the last three years in an excel spreadsheet and graph each overtime in a separate graph. Compare relationship between them. on website use prices the change in CPI is the inflation rate unemployment and GDP. consumer price index for all carbon consumers all items, sa, seasonly adjusted prices. (u) civilian unemployment rate and GDP real gross domestic product, 3 decimal GDParrow_forwardExplain what the implications of moving towards a ‘gig economy’, where fewer people work full-time jobs, will have on the unemployment rate and on the output of the economy.arrow_forward
- Britney is a baseball fan and attends several games per season. Her expenses per season are listed in the table below: Year 1 Year 2 5 Baseball Tickets $500 $560 Jersey $120 $150 Food $150 $160 Transport $60 $70 Assuming that year 1 is the base year, calculate the price index for year 1 and for year 2. Question 3 options: 88, 100 88, 113 100, 113 100, 88arrow_forwardThe following table contains unemployment statistics from 2013 for three different countries: Australia, the Netherlands, and France. (Source: “International Labor Comparisons.”Bureau of Labor Statistics) Fill in the table using the given data. Country Working-Age (Civilian Not in Civilian Employed Unemployed Unemployment Non-institutionalized) the Labor Force Labor Force (Thousands) (Thousands) Rate Population (Thousands) (Thousands) (Percent) (Thousands) Australia 18,332 6,196 12,136 11,501 635 Netherlands 13,629 4,796 8,364 469 France 22,411 25,547 2,824arrow_forwardCurrent Spot Rates. Use the table | containing economic, financial, and business indicators to answer the following questions. What are the current spot exchange rates for the following currency exchanges? a. Japanese yen/U.S. dollar exchange rate b. Japanese yen/Australian dollar exchange rate c. Australian dollar/U.S. dollar exchange rate What are the current spot exchange rates for the following currency exchanges? a. Japanese yen/U.S. dollar exchange rate The Japanese yen/U.S. dollar exchange rate is ¥ S. (Round to two decimal places.) b. Japanese yen/Australian dollar exchange rate The Japanese yen/Australian dollar exchange rate is ¥ IA$. (Round to two decimal places.) c. Australian dollar/U.S. dollar exchange rate The Australian dollar/U.S. dollar exchange rate is A$ /$. (Round to two decimal places.)arrow_forward
- Show how the unemployment rate in each month is calculated from the numbers of people.arrow_forwardBritney is a baseball fan and attends several games per season. Her expenses per season are listed in the table below: Year 2 Year 1 5 Baseball $500$560 Tickets Jersey $120 $150 $150 $160 Food Transport $60 S$70 Assuming that year 1 is the base year, calculate the price index for year 1 and for year 2. 100, 113 100, 88 88, 113 88, 100arrow_forwardEcon1101 Macro Principles -001 Homework: Homework - Chapter Lindsay Cola &9/26/19 5:20 PM 6 Score: 0.33 of 1 pt Save 13 of 25 (13 complete) Text Problem 9 HW Score: 47.33 %, 11.83 of 25 pts Question Help In addition to the national Consumer Price Index (CPI) discussed in this chapter, the Bureau of Labor Statistics produces several regional CPI indices. These are constructed in the same way as the national CPI, just at a smaller scale: in a given city, researchers gather prices for a bundle of goods every month and then construct an index to track price changes of that bundle within the city. The following table shows the CPI indices (base period 1982-1984 100) for San Francisco-Oakland-San Jose and Los Angeles-Riverside-Orange County, from 2007 to 2014: Year Los Angeles-Riverside-Orange Country San Francisco-Oakland-San Jose 2007 216.048 217.338 2008 222.767 225.008 2009 224.395 223.219 2010 227.469 225.894 2011 233.390 231.928 2012 239.650 236.648 2013 245.023 239.207 2014 251.985…arrow_forward
arrow_back_ios
SEE MORE QUESTIONS
arrow_forward_ios
Recommended textbooks for you
 Principles of Economics (12th Edition)EconomicsISBN:9780134078779Author:Karl E. Case, Ray C. Fair, Sharon E. OsterPublisher:PEARSON
 Engineering Economy (17th Edition)EconomicsISBN:9780134870069Author:William G. Sullivan, Elin M. Wicks, C. Patrick KoellingPublisher:PEARSON
 Principles of Economics (MindTap Course List)EconomicsISBN:9781305585126Author:N. Gregory MankiwPublisher:Cengage Learning
 Managerial Economics: A Problem Solving ApproachEconomicsISBN:9781337106665Author:Luke M. Froeb, Brian T. McCann, Michael R. Ward, Mike ShorPublisher:Cengage Learning
 Managerial Economics & Business Strategy (Mcgraw-...EconomicsISBN:9781259290619Author:Michael Baye, Jeff PrincePublisher:McGraw-Hill Education
Principles of Economics (12th Edition)
Economics
ISBN:9780134078779
Author:Karl E. Case, Ray C. Fair, Sharon E. Oster
Publisher:PEARSON
Engineering Economy (17th Edition)
Economics
ISBN:9780134870069
Author:William G. Sullivan, Elin M. Wicks, C. Patrick Koelling
Publisher:PEARSON
Principles of Economics (MindTap Course List)
Economics
ISBN:9781305585126
Author:N. Gregory Mankiw
Publisher:Cengage Learning
Managerial Economics: A Problem Solving Approach
Economics
ISBN:9781337106665
Author:Luke M. Froeb, Brian T. McCann, Michael R. Ward, Mike Shor
Publisher:Cengage Learning
Managerial Economics & Business Strategy (Mcgraw-...
Economics
ISBN:9781259290619
Author:Michael Baye, Jeff Prince
Publisher:McGraw-Hill Education