Financial Accounting: The Impact on Decision Makers
10th Edition
ISBN: 9781305654174
Author: Gary A. Porter, Curtis L. Norton
Publisher: Cengage Learning
expand_more
expand_more
format_list_bulleted
Question

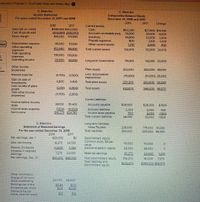
Transcribed Image Text:rehensive Problem 2- St of Cash Flows and Ratios Algo
C. Klein Inc.
C. Klein Inc.
Income Statement
Comparative Balance Sheets
December 31, 2018 and 2017
For years ended December 31, 2017 and 2018
2018
2017
Change
2018
2017
$469,000 $422,000
(303,000) (248,000)
166,000 174,000
Current assets:
Sales (all on credit)
Cost of goods sold
Gross margin
Cash
$52.260
34,000
$37,900 $14,360
Accounts receivable (net)
28,000
6,000
Inventory
Prepaid expenses
44,000
42,000
2100
2,000
-1,200
900
Depreciation expense
Other operating
5631
36,000
51,000
Other current assets
1310
2000
-690
102,000
85,000
Totol current assets
132,470
112,000 20,470
expenses
Total operating
138,000 136,000
expenses
ok
Operating income
28.000
38,000
Long-term Investments
75,000
52,000 23,000
Other income
(expenses)
Plant assets
302,000
253,000 49,000
nces
Interest expense
(4,700)
(3,500)
Less: accumulated
(76,800)
(51,000) 25,800
depreciation
Gain on sale of
4,900
3,400
Total plant assets
225,200
202,000 23,200
investments
Loss on sale of plant
(2100)
(2.500)
Total assets
432670
366,000 66.670
Ossets
Total other income
(expenses)
(11,700)
(2,600)
Current liabilities:
Income before income
taxes
26,100
35.400
Accounts payeble
$25,500
$26,000
S-500
Income taxes expense
(7,830)
(10,620)
Accrued liabilities
2,400
500
28,400
2000
2000
30,000
400
Net income
$18,270 $24.780
Income taxes payable
Total current liobilities
-1.500
-1,600
C. Kleln Inc.
Statement of Retained Earnings
Long term liabilities:
Notes Payable
236,000
175,000 61.000
For the year ended December 31, 2018
Total lisbilities
264.400
205.000 59.400
2018
2017
Ret esrnings, Jan. 1
$0
Stockholders' equity
Common stock, $5 par
$23,000
Add: net income
18,270
24,780
110,000
110,000
value
Deduct: Dividends
Increose in retained
earnings
Ret eornings, Dec. 31
(11,000),
(1.780)
Additional paid-in capital
28,000
28,000
7.270
23,000
Retained earnings
30.270
23.000
7.270
Total stockholders' equity
Total liobilities and
stockholders' equity
$30.270 $23.000
168,270
161,000
7,270
$432.670
$366.000 $66,670
Other informotion:
Shares of common
stock outstonding
Eamings per share
Dividends per share
Market price per
shore, common stock
22,000
22,000
$0.83
S0.5
$113
$0.08
$13
$12

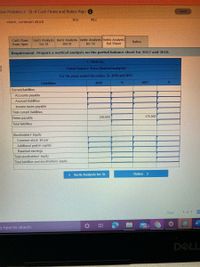
Transcribed Image Text:sive Problem 2-St of Cash Flows and Ratios Algo i
Sived
$13
$12
share, common stock
Cash Flows
from Oper
Horiz Analysis Horiz AnalysisVertic Analysis Vertic Analysis
Bal Sheet
Ratios
Inc St
Bal St
Inc St
Requirement Prepare a vertical analysis on the partial balance sheet for 2017 and 2018.
C. Klein Inc.
Partial Balance Sheet (Vertical analysis)
For the years ended December 31, 2018 and 2017
Liabilities
2018
2017
Current liabilities:
Accounts payable
Accrued liabilities
Income taxes payable
Total current liabilities
Notes payable
236,000
175,000
Total liabilities
Stockholders' Equity
Common stock, $5 par
Additional paid-in capital
Retained earnings
Total stockholders' equity
Total liabilities and stockholders' equity
Ratios >
< Vertic Analysis Inc St
Prev
1 of 1
e here to search
99+
DELL
Expert Solution
arrow_forward
Step 1 : Notes
- Under vertical analysis of balance sheet , each item in a balance sheet is shown as a percentage of total assets or total liabilities and shareholders' equity .
Step by stepSolved in 2 steps

Knowledge Booster
Similar questions
- Ratio Analysis Consider the following information taken from Chicago Water Slides (CWSs) financial statements: Also, CWSs operating cash flows were $25,658 and $29,748 in 2019 and 2018, respectively. Note: Round all answers to two decimal places. Required: 1. Calculate the current ratios for 2019 and 2018. 2. Calculate the quick ratios for 2019 and 2018. 3. Calculate the cash ratios for 2019 and 2018. 4. Calculate the operating cash flow ratios for 2019 and 2018. 5. CONCEPTUAL CONNECTION Provide some reasons why CWSs liquidity may be considered to be improving and some reasons why it may be worsening.arrow_forwardHow does Accounts Payable impact Declan's Designs' 2022 Statement of Cash Flows?arrow_forwardHow does Accounts Receivable impact Declan's Designs 2022 Statement of Cash Flows?arrow_forward
- QUESTION REQUIRED Use the information provided below to prepare the Cash Flow Statement of Jonah Ltd for the year ended 31 December 2022. (Some of the figures have already been entered in the answer book.) INFORMATION The Statement of Comprehensive Income of Jonah Ltd for the year ended 31 December 2022 and Statement of Financial Position as at 31 December 2021 and 2022 are as follows: STATEMENT OF COMPREHENSIVE INCOME FOR THE YEAR ENDED 31 DECEMBER 2022 Sales Cost of sales Gross profit Other operating income Gross income Distribution expenses Administrative expenses Earnings before interest and tax Interest income Interest expense Esmings before tax Company tax Earnings after interest and tax STATEMENT OF FINANCIAL POSITION AS AT 31 DECEMBER: ASSETS Non-current assets Land and buildings Plant and machinery Current assets Inventories Accounts receivable Total assets EQUITY AND LIABILITIES Equity Ordinary share capital Retained earnings Non-current liabilities Long-term borrowings…arrow_forward11 Compute Cash Flow from Operating Activities from the following details: Particulars Trade Receivables: Debtors CA Bills Receivable CA Trade Payables: Creditors CL Bills Payable CL L Expenses Outstanding Accrued Income CAT Depreciation on Fixed Assets No + Surplus, i.e., Balance in Statement of Profit & Loss 31st March, 2023 (R) 50,000 23,000 28,000 22,000 4,500 9,000 5,000 90,000 31st March 2022 ) 60,000 25,000 32,000 35,000 3,500 8,000 4,000 80,000arrow_forwardCALCULATE CASH FLOW TO CREDITOR'S FOR fy24arrow_forward
- Cash Flow Income Statement Revenue COGS Gross Profit Common Size BISON INC. Dividends Add to R/E Depreciation Expense Expenses EBIT Interest EBT Tax Net Income 2021 2021 Common Size 120,566 68,990 51,576 4,654 17,855 33,721 2,400 31,321 6,577.41 24,743.59 4,948.718 19,794.872 Balance Sheet Cash Accounts Receivable Inventory CURRENT ASSETS Fixed Assets: Gross Accum. Depreciation Net TOTAL ASSETS Liabilities Accounts Payable Salary Payable CURRENT LIABILITIES Long-Term Debt Total Liabilities Stockholder's Equity Common Stock Retained Earnings Total Stockholders' Equity Total Liabilities & Equity INDUSTRY AVERAGES 35.01% 2.95% 15.26% 53.22% 75.01% -28.23% 46.78% 100.00% 5.26% 4.68% 9.94% 18.42% 28.36% 22.41% 49.23% 71.64% 100.00% Income Statement Revenue COGS Gross Profit Depreciation Expense Expenses EBIT Interest EBT Tax Net Income 100.00% 40.01% 59.99% 10.58% 11.45% 37.96% 5.87% 32.09% 6.04% 26.05%arrow_forwardFind the following using the data bellow a. Accounts receivable B. Current assets C. Total assets D. Return on assets E. Common equity F. Quick ratioarrow_forward(Calculating financial ratios) The balance sheet and income statement for the J. P. Robard Mfg. Company are as follows: Operating return on assets Debt ratio Average collection period Fixed asset turnover Return on equity Current ratio Times interest earned Inventory turnover Total asset turnover Operating profit margin The company's current ratio is (Round to two decimal places.) . Calculate the following ratios:arrow_forward
- Sh19arrow_forwardPlease prepare cash flow statement for the year ended 31 Dec 2018, show T-Account of Retained earning, Dividend payable, Dividend at 31 Dec 2018arrow_forwardcompute the cash ratios for 2018 and 2017 (Round your answers to two decimal places, X.XX.) 2018:? 2017:? here is the data table Ranfield, Inc. Comparative Balance Sheet December 31, 2018 and 2017 2018 2017 2016* Assets Current Assets: Cash $91,000 $90,000 Accounts Receivables, Net 112,000 119,000 $102,000 Merchandise Inventory 148,000 160,000 202,000 Prepaid Expenses 17,000 6,000 Total Current Assets 368,000 375,000 Property, Plant, and Equipment, Net 213,000 174,000 Total Assets $581,000 $549,000 $596,000 Liabilities Total Current Liabilities $223,000 $241,000 Long-term Liabilities 115,000 98,000 Total Liabilities 338,000 339,000 Stockholders' Equity…arrow_forward
arrow_back_ios
SEE MORE QUESTIONS
arrow_forward_ios
Recommended textbooks for you
 Financial Accounting: The Impact on Decision Make...AccountingISBN:9781305654174Author:Gary A. Porter, Curtis L. NortonPublisher:Cengage Learning
 Cornerstones of Financial AccountingAccountingISBN:9781337690881Author:Jay Rich, Jeff JonesPublisher:Cengage Learning

Financial Accounting: The Impact on Decision Make...
Accounting
ISBN:9781305654174
Author:Gary A. Porter, Curtis L. Norton
Publisher:Cengage Learning

Cornerstones of Financial Accounting
Accounting
ISBN:9781337690881
Author:Jay Rich, Jeff Jones
Publisher:Cengage Learning
