Construct an x-R chart for the following data set. Note: Leave no cells blank - be certain to enter "O" wherever required. Do not round intermediate calculations. Round your answers to 2 decimal places. Sub group Number 6:00 10:00 1 14.0 12.6 14:00 13.2 18:00 22:00 Χ R 13.1 12.1 13.00 1.9 2345678OGENEN2222222222 13.2 13.3 12.7 13.4 12.1 12.94 1.3 13.5 12.8 13.0 12.8 12.4 12.90 1.1 13.9 12.4 13.3 13.1 13.2 13.18 1.5 13.0 13.0 12.1 12.2 13.3 12.72 1.2 13.7 12.0 12.5 12.4 12.4 12.60 1.7 13.9 12.1 12.7 13.4 13.0 13.02 1.8 13.4 13.6 13.0 12.4 13.5 13.18 1.2 9 14.4 12.4 12.2 12.4 12.5 12.78 2.2 10 13.3 12.4 12.6 12.9 12.8 12.80 0.9 11 13.3 12.8 13.0 13.0 13.1 13.04 0.5 12 13.6 12.5 13.3 13.5 12.8 13.14 1.1 13 13.4 13.3 12.0 13.0 13.1 12.96 1.4 14 13.9 13.1 13.5 12.6 12.8 13.18 1.3 15 14.2 12.7 12.9 12.9 12.5 13.04 1.7 16 13.6 12.6 12.4 12.5 12.2 12.66 1.4 17 14.0 13.2 12.4 13.0 13.0 13.12 1.6 18 13.1 12.9 13.5 12.3 12.8 12.92 1.2 19 14.6 13.7 13.4 12.2 12.5 13.28 2.4 20 13.9 13.0 13.0 13.2 12.6 13.14 1.3 21 13.3 12.7 12.6 12.8 12.7 12.82 0.7 13.9 12.4 12.7 12.4 12.8 12.84 1.5 13.2 12.3 12.6 13.1 12.7 12.78 0.9 13.2 12.8 12.8 12.3 12.6 12.74 0.9 13.3 12.8 12.0 12.3 12.2 12.52 1.3 Sum 323.30 34.0 Grand Mean 12.93 1.36 pictureClick here for the Excel Data File Data Points Central line Lower control limit (LCL) Upper control limit (UCL) X Chart R Chart
Construct an x-R chart for the following data set. Note: Leave no cells blank - be certain to enter "O" wherever required. Do not round intermediate calculations. Round your answers to 2 decimal places. Sub group Number 6:00 10:00 1 14.0 12.6 14:00 13.2 18:00 22:00 Χ R 13.1 12.1 13.00 1.9 2345678OGENEN2222222222 13.2 13.3 12.7 13.4 12.1 12.94 1.3 13.5 12.8 13.0 12.8 12.4 12.90 1.1 13.9 12.4 13.3 13.1 13.2 13.18 1.5 13.0 13.0 12.1 12.2 13.3 12.72 1.2 13.7 12.0 12.5 12.4 12.4 12.60 1.7 13.9 12.1 12.7 13.4 13.0 13.02 1.8 13.4 13.6 13.0 12.4 13.5 13.18 1.2 9 14.4 12.4 12.2 12.4 12.5 12.78 2.2 10 13.3 12.4 12.6 12.9 12.8 12.80 0.9 11 13.3 12.8 13.0 13.0 13.1 13.04 0.5 12 13.6 12.5 13.3 13.5 12.8 13.14 1.1 13 13.4 13.3 12.0 13.0 13.1 12.96 1.4 14 13.9 13.1 13.5 12.6 12.8 13.18 1.3 15 14.2 12.7 12.9 12.9 12.5 13.04 1.7 16 13.6 12.6 12.4 12.5 12.2 12.66 1.4 17 14.0 13.2 12.4 13.0 13.0 13.12 1.6 18 13.1 12.9 13.5 12.3 12.8 12.92 1.2 19 14.6 13.7 13.4 12.2 12.5 13.28 2.4 20 13.9 13.0 13.0 13.2 12.6 13.14 1.3 21 13.3 12.7 12.6 12.8 12.7 12.82 0.7 13.9 12.4 12.7 12.4 12.8 12.84 1.5 13.2 12.3 12.6 13.1 12.7 12.78 0.9 13.2 12.8 12.8 12.3 12.6 12.74 0.9 13.3 12.8 12.0 12.3 12.2 12.52 1.3 Sum 323.30 34.0 Grand Mean 12.93 1.36 pictureClick here for the Excel Data File Data Points Central line Lower control limit (LCL) Upper control limit (UCL) X Chart R Chart

Practical Management Science
6th Edition
ISBN:9781337406659
Author:WINSTON, Wayne L.
Publisher:WINSTON, Wayne L.
Chapter2: Introduction To Spreadsheet Modeling
Section: Chapter Questions
Problem 20P: Julie James is opening a lemonade stand. She believes the fixed cost per week of running the stand...

Related questions
Question
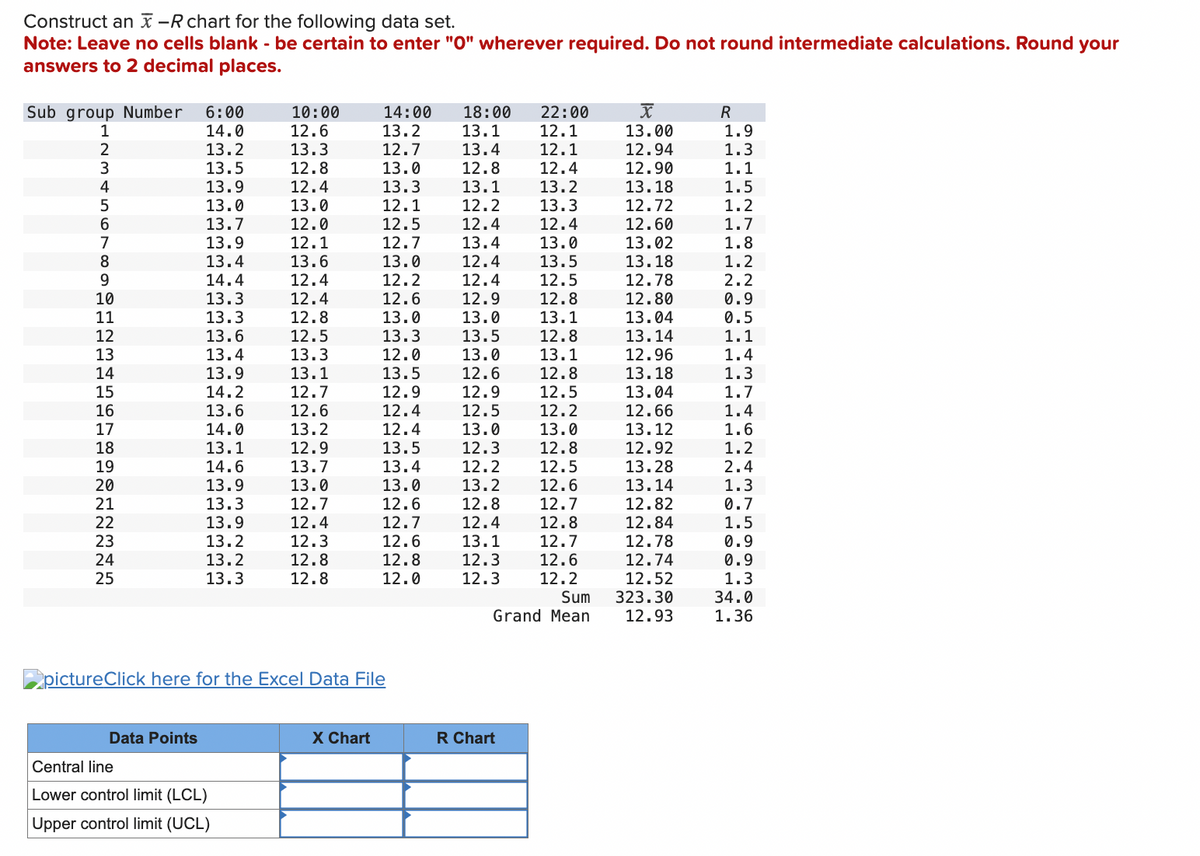
Transcribed Image Text:Construct an x-R chart for the following data set.
Note: Leave no cells blank - be certain to enter "O" wherever required. Do not round intermediate calculations. Round your
answers to 2 decimal places.
Sub group Number
6:00
10:00
1
14.0
12.6
14:00
13.2
18:00
22:00
Χ
R
13.1
12.1
13.00
1.9
2345678OGENEN2222222222
13.2
13.3
12.7
13.4
12.1
12.94
1.3
13.5
12.8
13.0
12.8
12.4
12.90
1.1
13.9
12.4
13.3
13.1
13.2
13.18
1.5
13.0
13.0
12.1
12.2
13.3
12.72
1.2
13.7
12.0
12.5
12.4
12.4
12.60
1.7
13.9
12.1
12.7
13.4
13.0
13.02
1.8
13.4
13.6
13.0
12.4
13.5
13.18
1.2
9
14.4
12.4
12.2
12.4
12.5
12.78
2.2
10
13.3
12.4
12.6
12.9
12.8
12.80
0.9
11
13.3
12.8
13.0
13.0
13.1
13.04
0.5
12
13.6
12.5
13.3
13.5
12.8
13.14
1.1
13
13.4
13.3
12.0
13.0
13.1
12.96
1.4
14
13.9
13.1
13.5
12.6
12.8
13.18
1.3
15
14.2
12.7
12.9
12.9
12.5
13.04
1.7
16
13.6
12.6
12.4
12.5
12.2
12.66
1.4
17
14.0
13.2
12.4
13.0
13.0
13.12
1.6
18
13.1
12.9
13.5
12.3
12.8
12.92
1.2
19
14.6
13.7
13.4
12.2
12.5
13.28
2.4
20
13.9
13.0
13.0
13.2
12.6
13.14
1.3
21
13.3
12.7
12.6
12.8
12.7
12.82
0.7
13.9
12.4
12.7
12.4
12.8
12.84
1.5
13.2
12.3
12.6
13.1
12.7
12.78
0.9
13.2
12.8
12.8
12.3
12.6
12.74
0.9
13.3
12.8
12.0
12.3
12.2
12.52
1.3
Sum
323.30
34.0
Grand Mean
12.93
1.36
pictureClick here for the Excel Data File
Data Points
Central line
Lower control limit (LCL)
Upper control limit (UCL)
X Chart
R Chart
Expert Solution
This question has been solved!
Explore an expertly crafted, step-by-step solution for a thorough understanding of key concepts.

This is a popular solution!

Trending now
This is a popular solution!

Step by step
Solved in 2 steps

Recommended textbooks for you
Practical Management Science
Operations Management
ISBN:
9781337406659
Author:
WINSTON, Wayne L.
Publisher:
Cengage,

Operations Management
Operations Management
ISBN:
9781259667473
Author:
William J Stevenson
Publisher:
McGraw-Hill Education

Operations and Supply Chain Management (Mcgraw-hi…
Operations Management
ISBN:
9781259666100
Author:
F. Robert Jacobs, Richard B Chase
Publisher:
McGraw-Hill Education
Practical Management Science
Operations Management
ISBN:
9781337406659
Author:
WINSTON, Wayne L.
Publisher:
Cengage,
Operations Management
Operations Management
ISBN:
9781259667473
Author:
William J Stevenson
Publisher:
McGraw-Hill Education
Operations and Supply Chain Management (Mcgraw-hi…
Operations Management
ISBN:
9781259666100
Author:
F. Robert Jacobs, Richard B Chase
Publisher:
McGraw-Hill Education


Purchasing and Supply Chain Management
Operations Management
ISBN:
9781285869681
Author:
Robert M. Monczka, Robert B. Handfield, Larry C. Giunipero, James L. Patterson
Publisher:
Cengage Learning

Production and Operations Analysis, Seventh Editi…
Operations Management
ISBN:
9781478623069
Author:
Steven Nahmias, Tava Lennon Olsen
Publisher:
Waveland Press, Inc.