Practical Management Science
6th Edition
ISBN: 9781337406659
Author: WINSTON, Wayne L.
Publisher: Cengage,
expand_more
expand_more
format_list_bulleted
Question
-
-
-
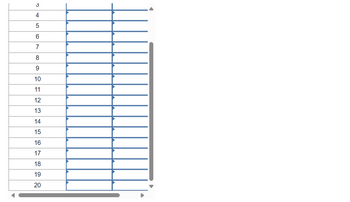
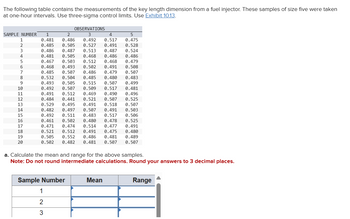
Determine X=�= and R¯¯¯�¯ .
Note: Round your answers to 3 decimal places.
2: -
Determine the UCL and LCL for a X−�− chart.
Note: Round your answers to 3 decimal places.
3: -
Determine the UCL and LCL for R-chart.
Note: Leave no cells blank - be certain to enter "0" wherever required. Round your answers to 3 decimal places.
4: -
What comments can you make about the process?
multiple choice
-
Process is in statistical control
-
Process is out of statistical control
-
-
-

Transcribed Image Text:4
5
6
7
8
9
10
11
12
13
14
15
16
17
18
19
20

Transcribed Image Text:The following table contains the measurements of the key length dimension from a fuel injector. These samples of size five were taken
at one-hour intervals. Use three-sigma control limits. Use Exhibit 10.13.
SAMPLE NUMBER 1
1
2
3
0.486
2
0.481 0.486
0.485 0.505
0.487
OBSERVATIONS
3
4
5
0.492 0.517 0.475
0.527 0.491 0.528
0.513
0.487 0.524
4
0.481 0.505
0.468
5
0.467 0.503
0.512
6
0.468
0.493
0.502
7
0.485
0.507
0.486
8
0.532
0.504
0.485
9
0.493
0.505 0.515
10
0.492
0.507
11
0.491
0.512
12
0.484
0.441
13
0.529 0.495
14
0.482
15
0.492
16
0.461
17
18
0.521 0.512
0.491
19
0.505 0.552
0.486
0.486 0.486
0.468 0.479
0.491 0.508
0.479 0.507
0.480 0.483
0.507 0.499
0.509 0.517 0.481
0.469 0.490 0.496
0.521 0.507 0.525
0.491 0.518 0.507
0.497 0.507 0.491 0.503
0.511 0.483 0.517 0.506
0.502 0.480 0.478 0.525
0.471 0.474 0.514 0.477 0.491
0.475 0.480
0.481 0.489
20
0.502 0.482 0.481 0.507 0.507
a. Calculate the mean and range for the above samples.
Note: Do not round intermediate calculations. Round your answers to 3 decimal places.
Sample Number
Mean
Range
1
2
3
Expert Solution
This question has been solved!
Explore an expertly crafted, step-by-step solution for a thorough understanding of key concepts.
This is a popular solution
Trending nowThis is a popular solution!
Step by stepSolved in 2 steps with 1 images

Knowledge Booster
Similar questions
- A medical facility does MRI scans for sports injuries. Occasionally a test yields inconclusive result and must be repeated. Using the following 15 sample results for the number of retests in n = 150 observations each, determine the control limits for the proportion of retests. Use three sigma (standard deviations) limits. Is the process in control? Why/why not? (Round answers to 4 decimal places.)arrow_forward9. Two machines are currently in use in a process at the Dennis Kira Mfg. Co. The standards for this process are LSL = .470" and USL = .476". Machine One is currently producing with mean = .474" and standard deviation .0003". Machine Two is currently producing with mean .4745" and standard deviation .0002". Which machine has the higher capability index? Machine One has an index of (round your response to two decimal places). (round your response to two decimal places). Machine Two has an index of Machine (1) (1) Two One has the higher capability index.arrow_forwardFor a particular process, the mean value, Xbar, is 1.011 and the mean range value, Rbar, is 0.102. If the product specification is 1.000 +/- 0.050, calculate the process capability for a sample size is 4. Question options: 0.194 0.237 0.297 0.397 0.549 0.624 0.734 0.929arrow_forward
- I need help with part c of the question.arrow_forwardPlease do not give solution in image format thankuarrow_forward(c) Based on what we know about Observation B, if the cutoff value is lowered to 0.2, what happens to the values of sensitivity and specificity? Explain. Use the ROC curve to estimate the values of sensitivity and specificity for a cutoff value of 0.2. If required, round your answers to three decimal places. Do not round intermediate calculations. Answer Part C, there are no other parts here. I have the sensitivity already and is equal to 1. What is the specificity??If you are not 100% sure you are right, do not attempt this is frustrating. The cutoff value has changed from 0.5 to 0.2. The sensitivity is 1 which is correct. I need help with the specificity. Sensitivity does not equal 1/14 and specificity does not equal 1/31 so don't answer that and do not answer any other parts just answer part C.arrow_forward
- 3/4 " roller chain is to transmit power from a 17-tooth drive sprocket to 34-tooth sprocket. Centers of the sprockets are 13 inches apart. Estimate the number of teeth in contact with the chain for the larger sprocket. ANS: 19 NO AI GENERATED SOLUTION PLS. ANSWER & EXPLAIN THE SOLUTION IN DETAIL FOR A THUMBS UP. THANKS!arrow_forwardPlease do not give solution in image format thankuarrow_forwardTo set P Chart from raw data, which one of the following must be knowr Select one: a. Average of the sample means O b. Population size O c. The value of D3 and D4 d. Sample size e. The value of A2arrow_forward
- No chatgpt answer used i will give upvotesarrow_forward"The table below is data on telephone usage time by operators to serve customer requests that will be used to explain the use of Xbar and R-chart". Question: a. Create UCL and LCL with Limit Control Factor A2b. Create UCL and LCL with Limit Control Factor D3 and D4arrow_forwardwhat are gannt charts best used forarrow_forward
arrow_back_ios
SEE MORE QUESTIONS
arrow_forward_ios
Recommended textbooks for you
 Practical Management ScienceOperations ManagementISBN:9781337406659Author:WINSTON, Wayne L.Publisher:Cengage,
 Operations ManagementOperations ManagementISBN:9781259667473Author:William J StevensonPublisher:McGraw-Hill Education
 Operations and Supply Chain Management (Mcgraw-hi...Operations ManagementISBN:9781259666100Author:F. Robert Jacobs, Richard B ChasePublisher:McGraw-Hill Education
 Purchasing and Supply Chain ManagementOperations ManagementISBN:9781285869681Author:Robert M. Monczka, Robert B. Handfield, Larry C. Giunipero, James L. PattersonPublisher:Cengage Learning
 Production and Operations Analysis, Seventh Editi...Operations ManagementISBN:9781478623069Author:Steven Nahmias, Tava Lennon OlsenPublisher:Waveland Press, Inc.

Practical Management Science
Operations Management
ISBN:9781337406659
Author:WINSTON, Wayne L.
Publisher:Cengage,

Operations Management
Operations Management
ISBN:9781259667473
Author:William J Stevenson
Publisher:McGraw-Hill Education

Operations and Supply Chain Management (Mcgraw-hi...
Operations Management
ISBN:9781259666100
Author:F. Robert Jacobs, Richard B Chase
Publisher:McGraw-Hill Education


Purchasing and Supply Chain Management
Operations Management
ISBN:9781285869681
Author:Robert M. Monczka, Robert B. Handfield, Larry C. Giunipero, James L. Patterson
Publisher:Cengage Learning

Production and Operations Analysis, Seventh Editi...
Operations Management
ISBN:9781478623069
Author:Steven Nahmias, Tava Lennon Olsen
Publisher:Waveland Press, Inc.