
ENGR.ECONOMIC ANALYSIS
14th Edition
ISBN: 9780190931919
Author: NEWNAN
Publisher: Oxford University Press
expand_more
expand_more
format_list_bulleted
Related questions
Question
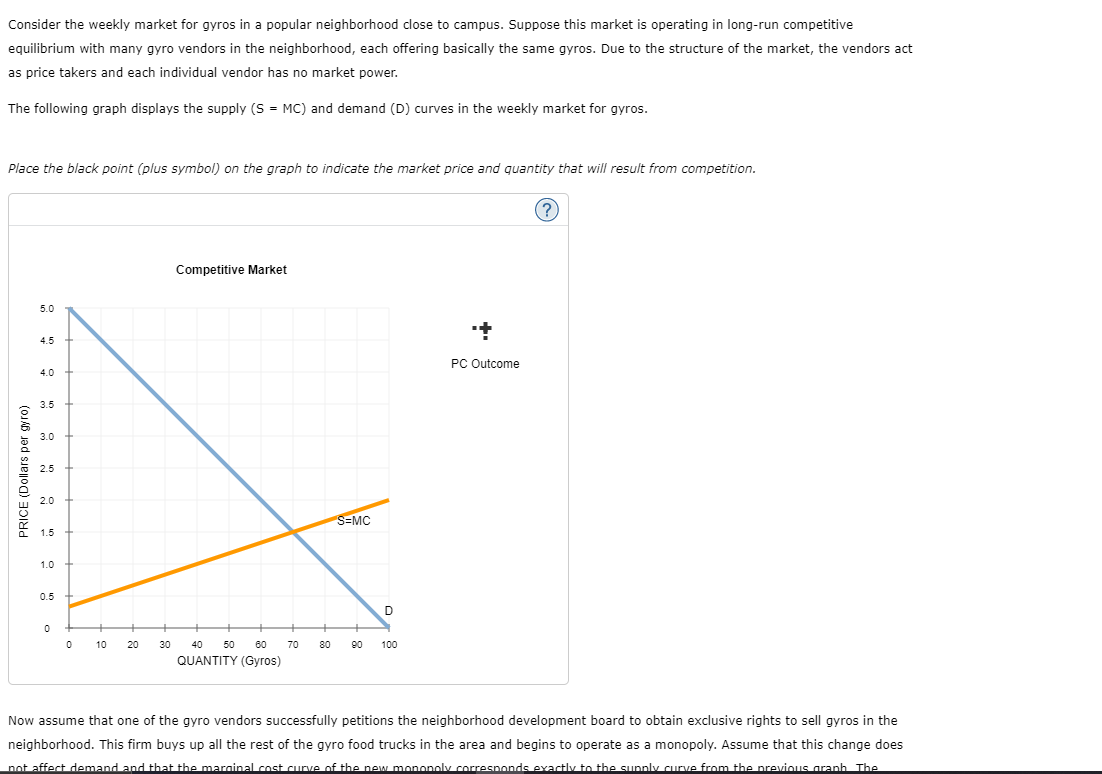

Transcribed Image Text:Consider the weekly market for gyros in a popular neighborhood close to campus. Suppose this market is operating in long-run competitive
equilibrium with many gyro vendors in the neighborhood, each offering basically the same gyros. Due to the structure of the market, the vendors act
as price takers and each individual vendor has no market power.
The following graph displays the supply (S = MC) and demand (D) curves in the weekly market for gyros.
Place the black point (plus symbol) on the graph to indicate the market price and quantity that will result from competition.
PRICE (Dollars per gyro)
5.0
4.5
4.0
3.5
3.0
2.0
1.5
1.0
0.5
0
0
10 20
30
Competitive Market
40
60
QUANTITY (Gyros)
50
70
80
S=MC
D
90 100
PC Outcome
(?)
Now assume that one of the gyro vendors successfully petitions the neighborhood development board to obtain exclusive rights to sell gyros in the
neighborhood. This firm buys up all the rest of the gyro food trucks in the area and begins to operate as a monopoly. Assume that this change does
not affect demand and that the marginal cost curve of the new monopoly corresponds exactly to the supply curve from the previous graph The

Transcribed Image Text:Now assume that one of the gyro vendors successfully petitions the neighborhood development board to obtain exclusive rights to sell gyros in the
neighborhood. This firm buys up all the rest of the gyro food trucks in the area and begins to operate as a monopoly. Assume that this change does
not affect demand and that the marginal cost curve of the new monopoly corresponds exactly to the supply curve from the previous graph. The
following graph reflects this new set of assumptions, and shows the demand (D), marginal revenue (MR), and marginal cost (MC) curves for the
monopoly vendor.
Place the black point (plus symbol) on the following graph to indicate the profit-maximizing price and quantity of a monopolist.
PRICE (Dollars per gyro)
5.0
4.5
4.0
3.5
3.0
1.5
1.0
0.5
0
0
10
20
30
Monopoly
MR
40
50 60
QUANTITY (Gyros)
70
MC
D
80 90 100
++
Monopoly Outcome
Deadweight Loss
(?)
Consider the welfare effects that result from the industry operating as a competitive market versus a monopoly.
On the monopoly graph, use the black points (plus symbol) to shade the area that represents the loss of welfare, or deadweight loss, caused by a
monopoly. That is, show the area that was formerly part of total surplus and now does not accrue to anybody.
Deadweight loss occurs when market is controlled by a monopoly because the resulting equilibrium is different from the (efficient) competitive
Expert Solution
This question has been solved!
Explore an expertly crafted, step-by-step solution for a thorough understanding of key concepts.

This is a popular solution

Trending nowThis is a popular solution!

Step by stepSolved in 3 steps with 2 images

Knowledge Booster


Learn more about
Need a deep-dive on the concept behind this application? Look no further. Learn more about this topic, economics and related others by exploring similar questions and additional content below.Similar questions
- then, plot the supply curve and equilibrium on the second photoarrow_forwardIn competitive markets, there are many small firms with each firm unable to influence the market price. Suppose company ABX operates in the wheat market. The company produces and markets wheats at a Price = $20 per container. The firm’s total costs are given as: TC = 50 +2Q + 3Q2 What level of output should the firm produce? Hint: Set P = MC and solve for Q. Use a graph to show your answers as wellarrow_forwardConsider the daily market for hot dogs in a small city. Suppose that this market is in long-run perfectly competitive equilibrium, with many hot dog stands in the city, each one selling the same kind of hot dogs. Therefore, each vendor is a price taker and possesses no market power. The following graph shows the demand (D) and supply curves (S = MC) in the market for hot dogs. Place the black point (plus symbol) on the graph to indicate the market price and quantity that will result from perfect competition. Use the green point (triangle symbol) to shade the area that represents consumers' surplus, and use the purple point (diamond symbol) to shade the area that represents producers' surplus. PRICE (Dollars per hot dog) 5.0 4.5 4.0 3.5 3.0 2.5 2.0 1.5 1.0 0.5 0 0 20 40 Perfectly Competitive Market S=MC D 60 80 100 120 140 160 180 200 QUANTITY (Hot dogs) PC Outcome A Consumers' Surplus Producers' Surplus Assume that one of the hot dog vendors successfully lobbies the city council to…arrow_forward
- 7. Short-run supply and long-run equilibrium Consider the competitive market for rhenium. Assume that no matter how many firms operate in the industry, every firm is identical and faces the same marginal cost (MC), average total cost (ATC), and average variable cost (AVC) curves plotted in the following graph. COSTS (Dollars per pound) 100 90 80 70 60 40 20 10 + 0 + 0 MC + 5 ATC AVC D 0 10 15 20 25 30 35 QUANTITY (Thousands of pounds) 40 + 45 50 ?arrow_forwardFor each of the following scenarios, identify the number of firms present, the type of product, and the appropriate market model. Select the matching entry for each dropdown box in the following table. Scenario Number of Firms Type of Product Market Model There are hundreds of colleges and universities that serve millions of college students each year. The colleges vary by location, size, and educational quality, which allows students with diverse preferences to find schools that match their needs. There are hundreds of high school students in need of algebra tutoring services. Dozens of companies offer tutoring services; parents view the quality of the tutoring at the different companies to be largely the same. In a small town, there are four providers of broadband Internet access: a cable company, the phone company, and two satellite companies. The Internet access offered by all four providers is of the same speed. Almost…arrow_forwardInitially, all firms in a perfectly competitive market are in long-run equilibrium. Assume that the market demand for the product produced by the firms in the market suddenly rises. Suppose the following graph shows the marginal revenue (MR) and marginal cost (MC) curves of a firm in this market at its initial long-run equilibrium, with an equilibrium price of P₁ and a profit-maximizing quantity of output of Q₁. Show the short-run effect of the increase in market demand on this firm by shifting the marginal revenue curve, the marginal cost curve, or both on the following graph. PRICE AND COST 2 MC Q₂ QUANTITY In the short run, the firm will respond by producing In the long run, some firms will respond by PRICE MR QUANTITY Supply MR Demand O Shift the demand curve, the supply curve, or both on the following graph to illustrate both the short-run effects and the new long-run equilibrium after firms finish adjusting to the increase in market demand. MC the industry. Demand goods and…arrow_forward
- Julius owns 100 acres of Florida orange orchards. Currently, he and other orange farmers are experiencing economic losses. As a result, Group of answer choices market supply will decrease and the price of oranges will fall. some farmers with leave the market and the price of oranges will rise. all the farmers should shut down in the long run. some farmers will leave the market and the farmers that stay will decrease their quantity produced.arrow_forward#2arrow_forwardConsider the weekly market for.gyros in a popular neighborhood close to campus. Suppose this market is operating in long-run competitive equilibrium with many gyro vendors in the neighborhood, each offering basically the same gyros. Due to the structure of the market, the vendors act as price takers and each individual vendor has no market power. The following graph displays the supply (SMC) and demand (D) curves in the weekly market for gyros. Place the black point (plus symbol) on the graph to indicate the market price and quantity that will result from competition. PRICE (Dollars per gyro) 5.0 4.5 4.0 Competitive Market 3.5 S=MC 3.0 2.5 2.0 1.5 1.0 0.5 D 0 0 50 100 150 200 250 300 350 400 450 500 PC Outcome (?)arrow_forward
- Suppose Madison operates a handicraft pop-up retail shop that sells rompers. Assume a perfectly competitive market structure for rompers with a market price equal to $20 per romper. The following graph shows Madison's total cost curve. Use the blue points (circle symbol) to plot total revenue and the green points (triangle symbol) to plot profit for rompers for quantities zero through seven (including zero and seven) that Madison produces. TOTAL COST AND REVENUE (Dollars) 200 175 150 125 100 75 0 -25 □ 0 ☐ 1 2 3 5 QUANTITY (Rompers) 4 6 Total Cost 7 8 o Total Revenue Profitarrow_forwardAb 41 Subject - Economicsarrow_forwardConsider the daily market for hot dogs in a small city. Suppose that this market is in long-run competitive equilibrium with many hot dog stands in the city, each one selling the same kind of hot dogs. Therefore, each vendor is a price taker and possesses no market power The following graph shows the demand (D) and supply (S = MC) curves in the market for hot dogs. Place the black point (plus symbol) on the graph to indicate the market price and quantity that will result from competition. Competitive Market 50 45 PC Outcome 4.0 635 3.0 2,5 + 20 15+ 10 05+ 45 90 116 100 225 270 315 360 405 450 QUANTITY (Hot dogs) PRICE (Dolere per hot dog)arrow_forward
arrow_back_ios
SEE MORE QUESTIONS
arrow_forward_ios
Recommended textbooks for you
 Principles of Economics (12th Edition)EconomicsISBN:9780134078779Author:Karl E. Case, Ray C. Fair, Sharon E. OsterPublisher:PEARSON
 Engineering Economy (17th Edition)EconomicsISBN:9780134870069Author:William G. Sullivan, Elin M. Wicks, C. Patrick KoellingPublisher:PEARSON
 Principles of Economics (MindTap Course List)EconomicsISBN:9781305585126Author:N. Gregory MankiwPublisher:Cengage Learning
 Managerial Economics: A Problem Solving ApproachEconomicsISBN:9781337106665Author:Luke M. Froeb, Brian T. McCann, Michael R. Ward, Mike ShorPublisher:Cengage Learning
 Managerial Economics & Business Strategy (Mcgraw-...EconomicsISBN:9781259290619Author:Michael Baye, Jeff PrincePublisher:McGraw-Hill Education
Principles of Economics (12th Edition)
Economics
ISBN:9780134078779
Author:Karl E. Case, Ray C. Fair, Sharon E. Oster
Publisher:PEARSON
Engineering Economy (17th Edition)
Economics
ISBN:9780134870069
Author:William G. Sullivan, Elin M. Wicks, C. Patrick Koelling
Publisher:PEARSON
Principles of Economics (MindTap Course List)
Economics
ISBN:9781305585126
Author:N. Gregory Mankiw
Publisher:Cengage Learning
Managerial Economics: A Problem Solving Approach
Economics
ISBN:9781337106665
Author:Luke M. Froeb, Brian T. McCann, Michael R. Ward, Mike Shor
Publisher:Cengage Learning
Managerial Economics & Business Strategy (Mcgraw-...
Economics
ISBN:9781259290619
Author:Michael Baye, Jeff Prince
Publisher:McGraw-Hill Education