ENGR.ECONOMIC ANALYSIS
14th Edition
ISBN: 9780190931919
Author: NEWNAN
Publisher: Oxford University Press
expand_more
expand_more
format_list_bulleted
Question

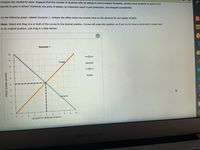
Transcribed Image Text:Consider the market for pens. Suppose that the number of students with an allergy to pencil erasers increases, causing more students to switch from
pendils to pens in school. Moreover, the price of plastic, an important input In pen production, has dropped considerably.
On the following graph, labeled Scenario 1, indicate the effect these two events have on the demand for and supply of pens.
Note: Select and drag one or both of the curves to the desired position. Curves will snap into position, so if you try to move a curve and it snaps back
to Its original position, just drag it a little farther.
A-Z
(?)
Scenarlo 1
10
Supply
Demand
(
7.
Supply
3.
Demand
8
10
3
5
6
1
QUANTITY (Millions of pens)
MacBook Air
PRICE (Dollars per pen)

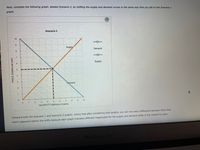
Transcribed Image Text:Next, complete the following graph, labeled Scenario 2, by shifting the supply and demand curves in the same way that you did on the Scenario 1
graph.
Scenario 2
10
Supply
Demand
8
7
6.
Supply
Demand
1
2
3
4.
6
7
10
QUANTITY (Millions of pens)
Compare both the Scenario 1 and Scenario 2 graphs. Notice that after completing both graphs, you can now see a difference between them that
wasn't apparent before the shifts because each graph indicates different magnitudes for the supply and demand shifts in the market for pens.
MacBook Air
PRICE (Dollars per pen)
Expert Solution
arrow_forward
Step 1
In the question above, it is given that :
- Consider a market for pens.
- A large number of students shift from pencils to pens due to allergy from pencils.
- The price of plastic which is an important input in the production of pens has fallen.
To find :
- Effect of these two events on demand and supply curve.
Trending nowThis is a popular solution!
Step by stepSolved in 2 steps with 2 images

Knowledge Booster
Learn more about
Need a deep-dive on the concept behind this application? Look no further. Learn more about this topic, economics and related others by exploring similar questions and additional content below.Similar questions
- Oyster crackers are a complement for clam chowder. If the price of clam chowder falls, the quantity of clam chowder demanded , which the demand for oyster crackers. Because of the change in the equilibrium quantity of oyster crackers, the demand for wheat flour by oyster cracker producers , causing the equilibrium price of wheat flour to . This means producers of bread face input prices, and the supply of bread . The resulting in the price of bread causes people to substitute , so the demand for cereal .arrow_forwardHow shifts in demand and supply affect equilibrium Consider the market for pens. Suppose that the number of students with an allergy to pencil erasers increases, causing more students to switch from pencils to pens in school. Moreover, the price of plastic, an important input in pen production, has dropped considerably. On the following graph, labeled Scenario 1, indicate the effect these two events have on the demand for and supply of pens. Note: Select and drag one or both of the curves to the desired position. Curves will snap into position, so if you try to move a curve and it snaps back to its original position, just drag it a little farther. Scenario 1DemandSupply012345678910109876543210PRICE (Dollars per pen)QUANTITY (Millions of pens)Demand Supply Next, complete the following graph, labeled Scenario 2, by shifting the supply and demand curves in the same way that you did on the Scenario 1 graph. Scenario 2DemandSupply012345678910109876543210PRICE…arrow_forwardA certain manufacturer has determined that the weekly demand and supply functions for their product are given by the equations: supply: p=-2x² +80 demand: p = 15x+30 where z represents the quantity demanded in units of a thousand and p is the unit price in dollars. Find the market equilibrium (equilibrium price and equilibrium quantity).arrow_forward
- Consider the market for pens. Suppose that the number of students who are allergic to the rubber used in pencil erasers increases, leading more students to switch from pencils to pens in school. Further, the price of ink, a major input in the pen production process, has increased sharply. On the following graph, labeled Scenario 1, indicate the effect these two events have on the demand for and supply of pens. Note: Select and drag one or both of the curves to the desired position. Curves will snap into position, so if you try to move a curve and it snaps back to its original position, just drag it a little farther. 10 P 2 1 D 10 9 3 2 1 0 Next, complete the following graph, labeled Scenario 2, by shifting the supply and demand curves in the same way that you did on the Scenario 1 graph. 0 1 2 Scenario 1 3 Scenario 2 Supply Demand Supply 5 6 QUANTITY (Millions of pens) Equilibrium Object Price Quantity Demand 7 8 9 10 -o Demand Supply Scenario 1 (?) Demand Compare both the Scenario 1…arrow_forwardThe following graph presents the market for sweaters in 2018. Between 2018 and 2019, the equilibrium price of sweaters remained constant, but the equilibrium quantity of sweaters increased. Given this information, you can conclude that between 2018 and 2019, the supply of sweaters and the demand for sweaters decreased PRICE (Dollars per sweater) increased was unchanged he graph to illustrate your answer by showing the positions of the supply and demand curves in 2019. rag one or both of the curves to the desired position. Curves will snap into position, so if you try to move a curve and it snaps back on, just drag it a little farther. QUANTITY (Sweaters) Supply Demand Demand Supply ?arrow_forwardThere has been explosive growth in the demand for the green leafy vegetable kale in recent years as consumers learned of its health benefits. The demand curve has shifted significantly rightward. However, the price of a bunch of kale in the grocery store has been fairly stable. Draw a supply and demand diagram showing the market for kale, and show how the price of kale could remain stable in the face of such an enormous growth in demand. 1.) please plot the new supply and demand curves on a diagram and label the lines properly. 2.) please also indicate the new equilibrium point at the same price as the original equilibrium and label it.arrow_forward
- Please answer all parts.arrow_forwardThe following graph plots the demand curve (blue line) for several consumers in the market for VR headsets in Mead, a small town located in Colorado. The Mead market price of a VR headset is given by the horizontal black line at $180. Each rectangle you can place on the following graph corresponds to a particular buyer in this market: orange (square symbols) for Jacques, green (triangle symbols) for Kyoko, purple (diamond symbols) for Musashi, tan (dash symbols) for Rina, and blue (circle symbols) for Sean. Use the rectangles to shade the areas representing consumer surplus for each person who is willing and able to purchase a VR headset at a market price of $180. (Note: If a person will not purchase a VR headset at the market price, indicate this by leaving his or her rectangle in its original position on the palette.) PRICE (Dollars per VR headset) 480 420 360 300 240 180 120 60 0 0 1 Jacques 2 Kyoko Musashi Rina Sean 3 4 5 QUANTITY (VR headsets) Market Price 6 7 8 Based on the…arrow_forwardYou own a hot dog stand that you set up outside the student union every day at lunch time. Currently, you are selling hot dogs for a price of $3, and you sell 30 hot dogs a day (point A on the diagram). You are considering cutting the price to $2. The graph shows two possible increases in the quantity sold as a result of your price cut. Use the information in the graph (new quantities are given on the horizontal axis) to calculate the price elasticity between these two prices on each of the demand curves. Use the midpoint formula to calculate the price elasticities. A On the demand curve containing the points "A" and "B", the price elasticity of demand for a price cut from $3 to $2 is|. (Hint: Include the negative sign and enter your response rounded to two decimal places.) D2 On the demand curve containing the points "A" and "C", the price elasticity of demand for a price cut from $3 to $2 is. (Hint: Include the negative sign and enter your response rounded to two decimal places.) :37…arrow_forward
- DS Determinants of supply The following calculator shows the supply curve for sedans in an imaginary market. For simplicity, assume that all sedans are identical and sell for the same price. Two factors that affect the supply of sedans are the level of technical knowledge-in this case, the speed with which manufacturing robots can fasten bolts, or robot speed-and the wage rate that auto manufacturers must pay their employees. Initially, the graph shows the supply curve when robots can fasten 2,500 bolts per hour and autoworkers earn $25 per hour. Use the graph input tool to help you answer the following questions. You will not be graded on any changes you make to this graph. Note: Once you enter a value in a white field, the graph and any corresponding amounts in each grey field will change accordingly. PRICE (Thousands of dollars) 8 20 10 0 0 Supply 100 200 300 400 500 600 700 800 900 QUANTITY (Sedans per month) Graph Input Tool Supply for Sedans Price of a Sedan (Thousands of…arrow_forwardSuppose the Mayo publishes a study finding that the caffeine in coffee increases the probability of getting Alzheimer’s. How do you imagine this will affect the market for coffee? Which determinant of demand or supply is being affected? Show graphically with before and after curves on the same axes. How will this change affect the equilibrium price and quantity of coffee? Explain your reasoning.arrow_forwardSuppose both the demand for olives and the supply of olives decline by equal amounts over some time period. Use graphical analysis to show the effect on equilibrium price and quantity. Instructions: On the graph below, use your mouse to click and drag the supply and demand curves as necessary. D1 Quantity of olives Price of olivesarrow_forward
arrow_back_ios
SEE MORE QUESTIONS
arrow_forward_ios
Recommended textbooks for you

 Principles of Economics (12th Edition)EconomicsISBN:9780134078779Author:Karl E. Case, Ray C. Fair, Sharon E. OsterPublisher:PEARSON
 Engineering Economy (17th Edition)EconomicsISBN:9780134870069Author:William G. Sullivan, Elin M. Wicks, C. Patrick KoellingPublisher:PEARSON
 Principles of Economics (MindTap Course List)EconomicsISBN:9781305585126Author:N. Gregory MankiwPublisher:Cengage Learning
 Managerial Economics: A Problem Solving ApproachEconomicsISBN:9781337106665Author:Luke M. Froeb, Brian T. McCann, Michael R. Ward, Mike ShorPublisher:Cengage Learning
 Managerial Economics & Business Strategy (Mcgraw-...EconomicsISBN:9781259290619Author:Michael Baye, Jeff PrincePublisher:McGraw-Hill Education


Principles of Economics (12th Edition)
Economics
ISBN:9780134078779
Author:Karl E. Case, Ray C. Fair, Sharon E. Oster
Publisher:PEARSON

Engineering Economy (17th Edition)
Economics
ISBN:9780134870069
Author:William G. Sullivan, Elin M. Wicks, C. Patrick Koelling
Publisher:PEARSON

Principles of Economics (MindTap Course List)
Economics
ISBN:9781305585126
Author:N. Gregory Mankiw
Publisher:Cengage Learning

Managerial Economics: A Problem Solving Approach
Economics
ISBN:9781337106665
Author:Luke M. Froeb, Brian T. McCann, Michael R. Ward, Mike Shor
Publisher:Cengage Learning

Managerial Economics & Business Strategy (Mcgraw-...
Economics
ISBN:9781259290619
Author:Michael Baye, Jeff Prince
Publisher:McGraw-Hill Education