MATLAB: An Introduction with Applications
6th Edition
ISBN: 9781119256830
Author: Amos Gilat
Publisher: John Wiley & Sons Inc
expand_more
expand_more
format_list_bulleted
Concept explainers
Question
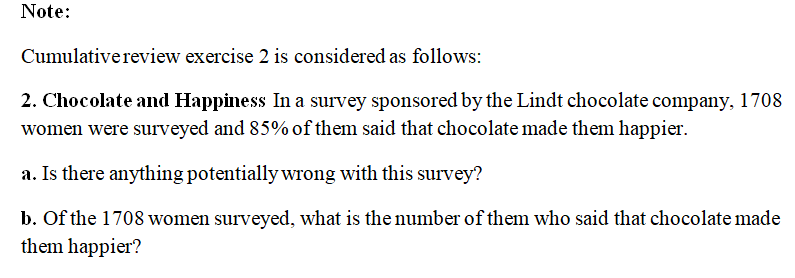
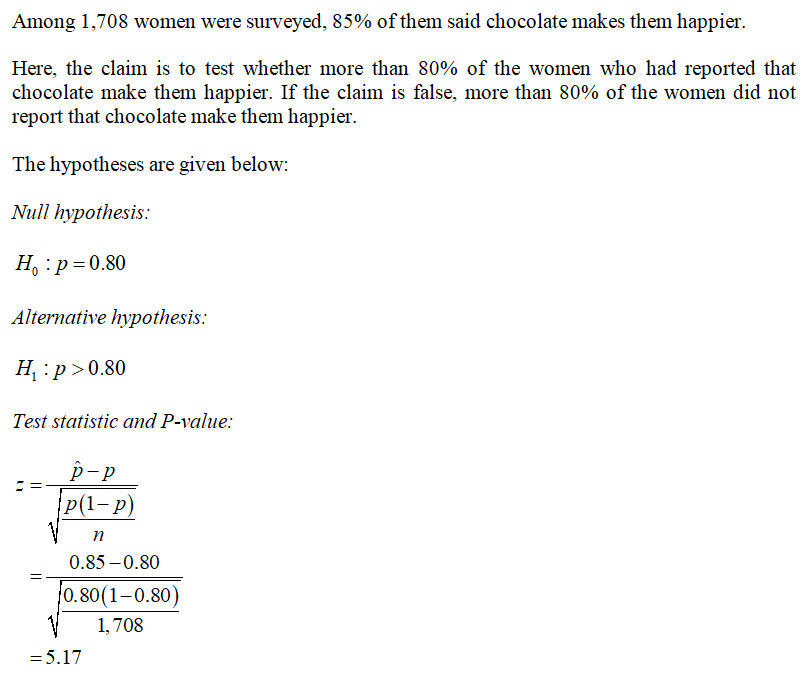
Chocolate and Happiness Use the results from part (b) of Cumulative Review Exercise 2 to test the claim that when asked, more than 80% of women say that chocolate makes them happier. Use a 0.01 significance level.
Expert Solution
arrow_forward
Step 1

arrow_forward
Step 2

Step by stepSolved in 4 steps with 3 images

Knowledge Booster
Learn more about
Need a deep-dive on the concept behind this application? Look no further. Learn more about this topic, statistics and related others by exploring similar questions and additional content below.Similar questions
- Do iPads Help Kindergartners Learn: A Subtest The Auburn, Maine, school district conducted an early literacy experiment in the fall of 2011. In September, half of the kindergarten classes were randomly assigned iPads (the intervention group) while the other half of the classes got them in December (the control group.) Kids were tested in September and December and the study measures the average difference in score gains between the control and intervention group.52 The experimenters tested whether the mean score for the intervention group was higher on the HRSIW subtest (Hearing and Recording Sounds in Words) than the mean score for the control group. a)State the null and alternative hypotheses of the test and define any relevant parameters. b) The p-value for the test is 0.02. State the conclusion of the test in context. Are the results statistically significant at the 5% level? c) The effect size was about two points, which means the mean score for the intervention group was…arrow_forwardI need help finding the test statistic (part b) and finding the p-value (part c)arrow_forwardA case-control (or retrospective) study was conducted to investigate a relationship between the colors of helmets worn by motorcycle drivers and whether they are injured or killed in a crash. Results are given in the accompanying table. Using a 0.05 significance level, test the claim that injuries are independent of helmet color. Black; White; Yellow; Red; Blue Controls (not injured) 500; 355; 32; 173; 79 Cases (injured or killed) 220; 115; 9; 71; 38arrow_forward
- A survey asked students for their college and their satisfaction with their program. The results are provided in the tables below. Determine if there is a relationship between college and satisfaction at the 0.05 level of significance. Satisfied Not Satisfied Arts and Sciences 5 2 Education 6 1 Technology 14 12 Business 18 12 Health Profession 10 4 Social and Behavioral Sciences 8 12 H0: College and Satisfaction are independent. H1 : College and Satisfaction are dependent. Determine the p-value. What is the correct decision for this test? What is your conclusion, in context? Explain your reasoning.arrow_forwardA poll was conducted to investigate opinions about global warming. The respondents who answered yes when asked if there is solid evidence that the earth is getting warmer were then asked to select a cause of global warming. The results are given in the accompanying data table. Use a 0.01 significance level to test the claim that the sex of the respondent is independent of the choice for the cause of global warming. Do men and women appear to agree, or is there a substantial difference? Human activity Natural patterns Don't know Male 310 139 36 Female 335 156 34 Click here to view the chi-square distribution table. Identify the null and alternative hypotheses. Họ: The sex of the respondent and the choice for the cause of global warming are independent. H1: The sex of the respondent and the choice for the cause of global warming are dependent. Compute the test statistic. 0.422 (Round to three decimal places as needed.) Find the critical value(s). (Round to three decimal places as needed.…arrow_forwardPerception and Reality In a presidential election, 308 out of 611 voters surveyed said that they voted for the candidate who won (based on data from ICR Survey Research Group). Use a 0.05 significance level to test the claim that among all voters, the percentage who believe that they voted for the winning candidate is equal to 43%, which is the actual percentage of votes for the winning candidate. What does the result suggest about voter perceptions?arrow_forward
- The table below lists body temperatures obtained randomly selected subjects. The temperatures are categorized according to gender and whether the subject uses drug. Using a 0.05 significance level, test for an interaction between gender and usage of drug, test for an effect from gender, and test for an effect from usage of drug. What do you conclude? Use Drug Does Not Use Drug Male 98.4 97.4 96.8 98.2 98.4 97.4 97.4 98.0 Female 98.6 99.3 98.2 98.6 97.0 98.4 97.2 98.7arrow_forwardWhat social media tools do marketers commonly use? Researchers surveyed marketers who commonly use an indicated social media tool. Surveyed were B2B marketers, marketers focusing primarily on attracting businesses, and B2C marketers, marketers targeting consumers. Suppose the survey was based on 500 B2B and 500 B2C marketers and yielded the results in the table below. For each social media tool, at the 0.05 level of significance, determine whether there is a difference between B2B marketers and B2C marketers in the proportion who used each social media tool. Social Media Tool B2B B2CA 84% 91%B 84% 76%C 82 % 61%D 39% 53% What is the p-value for the test statistic and interpretation? For Tool B determine the test statistic. What is Tool B p-value 12. EOCarrow_forwardA survey of 1031 adults in a college asked whether they liked chocolate or strawberry ice cream more. Of those surveyed, 536 said they prefer chocolate. Determine and interpret the sample proportion. At the 5% significance level, does the data provide sufficient evidence to conclude that a majority of students in the college prefer chocolate ice cream?arrow_forward
arrow_back_ios
arrow_forward_ios
Recommended textbooks for you
 MATLAB: An Introduction with ApplicationsStatisticsISBN:9781119256830Author:Amos GilatPublisher:John Wiley & Sons Inc
 Probability and Statistics for Engineering and th...StatisticsISBN:9781305251809Author:Jay L. DevorePublisher:Cengage Learning
 Statistics for The Behavioral Sciences (MindTap C...StatisticsISBN:9781305504912Author:Frederick J Gravetter, Larry B. WallnauPublisher:Cengage Learning
 Elementary Statistics: Picturing the World (7th E...StatisticsISBN:9780134683416Author:Ron Larson, Betsy FarberPublisher:PEARSON
 The Basic Practice of StatisticsStatisticsISBN:9781319042578Author:David S. Moore, William I. Notz, Michael A. FlignerPublisher:W. H. Freeman
 Introduction to the Practice of StatisticsStatisticsISBN:9781319013387Author:David S. Moore, George P. McCabe, Bruce A. CraigPublisher:W. H. Freeman

MATLAB: An Introduction with Applications
Statistics
ISBN:9781119256830
Author:Amos Gilat
Publisher:John Wiley & Sons Inc

Probability and Statistics for Engineering and th...
Statistics
ISBN:9781305251809
Author:Jay L. Devore
Publisher:Cengage Learning

Statistics for The Behavioral Sciences (MindTap C...
Statistics
ISBN:9781305504912
Author:Frederick J Gravetter, Larry B. Wallnau
Publisher:Cengage Learning

Elementary Statistics: Picturing the World (7th E...
Statistics
ISBN:9780134683416
Author:Ron Larson, Betsy Farber
Publisher:PEARSON

The Basic Practice of Statistics
Statistics
ISBN:9781319042578
Author:David S. Moore, William I. Notz, Michael A. Fligner
Publisher:W. H. Freeman

Introduction to the Practice of Statistics
Statistics
ISBN:9781319013387
Author:David S. Moore, George P. McCabe, Bruce A. Craig
Publisher:W. H. Freeman