Related questions
Question
- Measure the distance between the sources, and the path distance from each of the sources to the nodal point shown on the diagram. Show the complete calculation for wavelength.
- Measure the path distances from each of the sources to the anti-nodal point shown on the diagram. Using measurements from part (i) for the distance between sources and the measurements made in part (ii), show the complete calculation for the wavelength.
- What effect would an increase in frequency have on the interference pattern?
- What effect would a decrease in the distance between the wave sources have on the interference pattern?
- If the phase of the vibrating sources was changed so that they were vibrating completely out of phase, what effect would this have on the interference pattern?
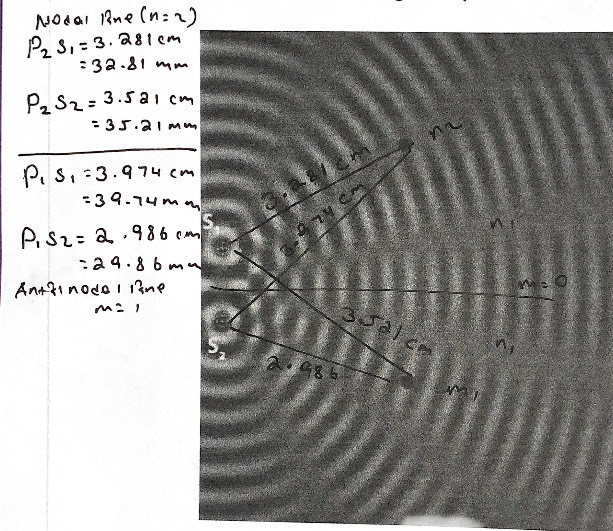

Transcribed Image Text:Nodal Rue (n=2)
P₂3₁=3.281 cm
=32.81mm
P₂ S₂= 3.521 cm
= 35.21 mm
P₁S₁ =3.974 cm
-39-74mm
P₁S2= 2.986 cm
29.86mu
Antti node ane
m² 1
2.986
35alce
NI
Expert Solution
This question has been solved!
Explore an expertly crafted, step-by-step solution for a thorough understanding of key concepts.

Step by stepSolved in 2 steps

Follow-up Questions
Read through expert solutions to related follow-up questions below.
Follow-up Question
can you please explain answer number 3?
Solution
by Bartleby Expert
Follow-up Question
Question number 4 and 5 are not answered
Solution
by Bartleby Expert
Follow-up Questions
Read through expert solutions to related follow-up questions below.
Follow-up Question
can you please explain answer number 3?
Solution
by Bartleby Expert
Follow-up Question
Question number 4 and 5 are not answered
Solution
by Bartleby Expert
Knowledge Booster

Similar questions
- Please explain your answer in 1, 2 and 3 thank you.arrow_forwardconsider the effect of the spacing between the slits in the grating. What happens when you increase the number of slits per millimeter and decrease? and why do we see these results? Explain in terms of the interference between light wavespassing through the gratingarrow_forwardA. It appears that there should be a bright fringe at the location of point D. Why isn’tthere? Explain The previous figure is also labeled with points A and B which are at the locations of maximaand points C and D which are at the locations of minimum For Questions b and c below,you will need to discuss whether each of those minima/maxima stays at the same location,moves to the left or moves to the right and then explain your answers for each B. The slit width is slightly decreased C. The slit separation is slightly decreased.arrow_forward
- If a radio station is broadcasting at a wavelength x and the distance between the two radio towers is equal to 1/2x, then the intensity I of the signal in the direction (theta) is given by the equation in the picture I need help on Aarrow_forwardConsider the interference pattern at the right. (The crests are represented by thick lines and the troughs by thin lines.) The distance from S1 to point D is 47.2 cm. What is the wavelength? What is the distance from S2 to point D?arrow_forwardPlease help with question 2. only please.arrow_forward
- I need help defining these two laws and answering the question. Thank YOUarrow_forwardAs shown is the interference pattern seen on a viewing screen behind 2 slits. Suppose the 2 slits were replaced by 20 slits having the same spacing d between adjacent slits.a. Would the number of fringes on the screen increase, decrease, or stay the same?b. Would the fringe spacing increase, decrease, or stay the same?c. Would the width of each fringe increase, decrease, or stay the same?d. Would the brightness of each fringe increase, decrease, or stay the same?arrow_forward
arrow_back_ios
arrow_forward_ios