
FINANCIAL ACCOUNTING
10th Edition
ISBN: 9781259964947
Author: Libby
Publisher: MCG
expand_more
expand_more
format_list_bulleted
Related questions
Question
A) Calculate the following liquidity ratios for 2020.
1. Working capital -
2.Current Ratio -
3. Acid test ratio-
4. Accounts receivable turnover-
B) calculate the following liquidity ratios for 2020.
1. Average collection period (in days)-
2. Inventory turnover (in times)-
C) calculate the average days to sell inventory for 2020.
1. Average days to sell inventory-
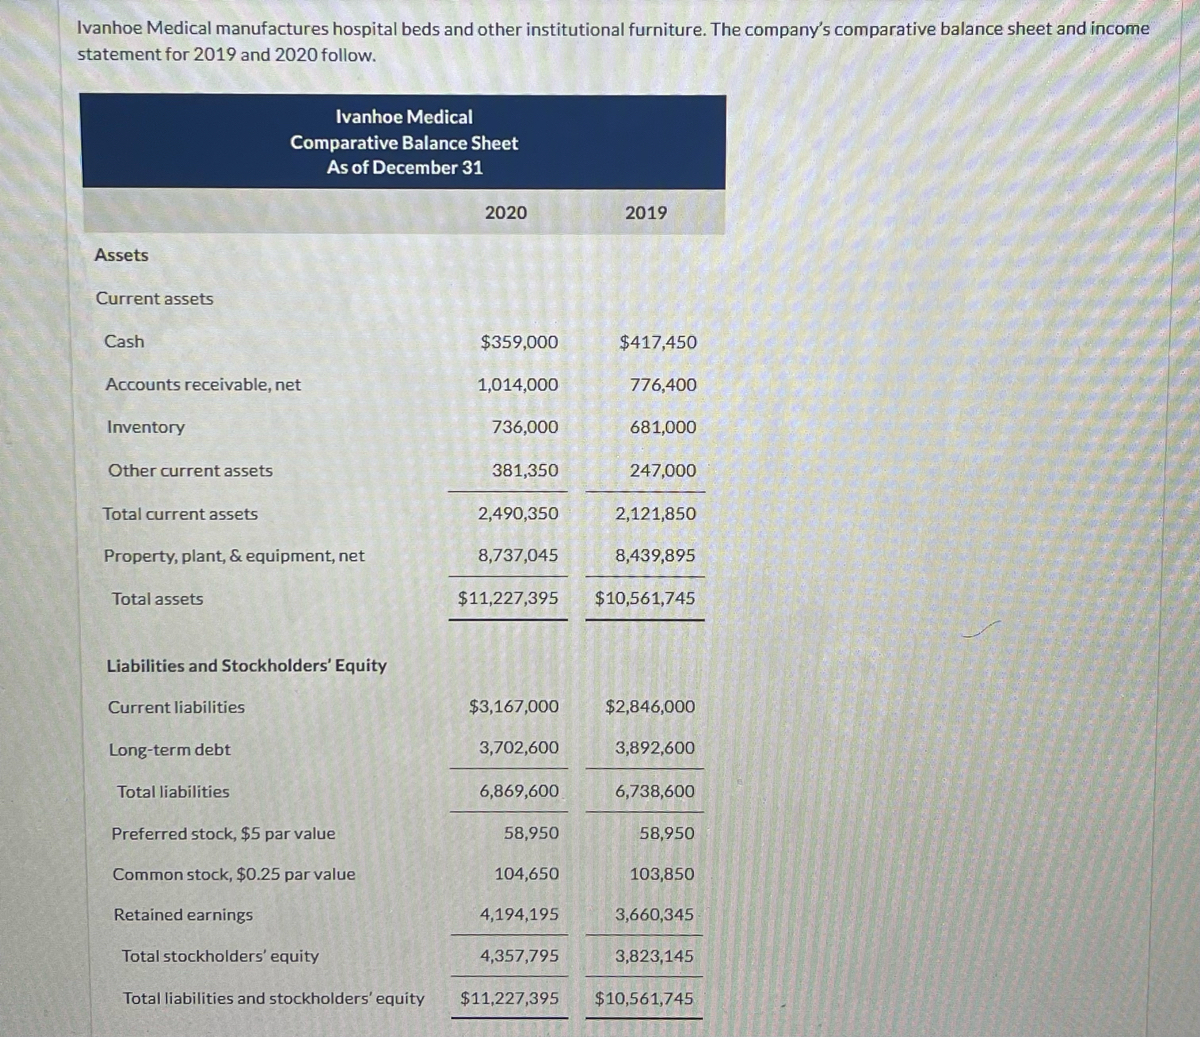

Transcribed Image Text:Ivanhoe Medical manufactures hospital beds and other institutional furniture. The company's comparative balance sheet and income
statement for 2019 and 2020 follow.
Assets
Current assets
Cash
Accounts receivable, net
Inventory
Other current assets
Total current assets
Ivanhoe Medical
Comparative Balance Sheet
As of December 31
Property, plant, & equipment, net
Total assets
Liabilities and Stockholders' Equity
Current liabilities
Long-term debt
Total liabilities
2020
par value
$359,000
1,014,000
736,000
381,350
2,490,350
8,737,045
$3,167,000
3,702,600
6,869,600
Preferred stock, $5 par value
Common stock,
Retained earnings
Total stockholders' equity
Total liabilities and stockholders' equity $11,227,395
58,950
$11,227,395 $10,561,745
104,6
4,194,195
2019
4,357,795
$417,450
776,400
681,000
247,000
2,121,850
8,439,895
$2,846,000
3,892,600
6,738,600
58,950
103,850
3,660,345
3,823,145
$10,561,745

Transcribed Image Text:Ivanhoe Medical
Comparative Income Statement and Statement of Retained Earnings
For the Year
Sales revenue (all on account)
Cost of goods sold
Gross profit
Operating expenses
Net operating income
Interest expense
Net income before taxes
Income taxes (30%)
Net income
Dividends paid
Preferred dividends
Common dividends
Total dividends paid
Net income retained
Retained earnings, beginning of year
Retained earnings, end of year
2020
$10,177,200
5,612,550
4,564,650
2,840,250
1,724,400
300,400
1,424,000
427,200
$996,800
29,500
433,450
462,950
533,850
2019
$9,613,950
5,298,800
4,315,150
2,634,150
1,681,000
308,650
1,372,350
411,705
$960,645
29,500
413,100
442,600
518,045
3,142,300
3,660,345
$4,194,195 $3,660,345
Expert Solution
This question has been solved!
Explore an expertly crafted, step-by-step solution for a thorough understanding of key concepts.

Step by stepSolved in 3 steps

Knowledge Booster


Learn more about
Need a deep-dive on the concept behind this application? Look no further. Learn more about this topic, accounting and related others by exploring similar questions and additional content below.Similar questions
- provide answer pleasearrow_forwardCompute the following ratios for 2022 and 2021. Inventory on December 31, 2020, was $330. Assets on December 31, 2020, were $1,910. Stockholders' equity-common on December 31, 2020, was $900. (Round current ratio and inventory turnover to 2 decimal place e.g. 15.25. Round other answers to 1 decimal place, e.g. 15.2 or 15.2%.) (a) (b) Inventory turnover (c) (d) (e) (f) Current ratio (g) Profit margin Return on assets Return on common stockholders' equity Debt to assets ratio Times interest earned 2022 1.67 2 7.73 :1 times % % % % times 2021 1.79 2 4.42 :1 times de % % % % timesarrow_forwardces Given the following information, complete the balance sheet shown next. Collection period Days' sales in cash Current ratio Inventory turnover Liabilities to assets Payables period Assets Current assets: Cash Accounts receivable Inventory Total current assets Net fixed assets Total assets (All sales are on credit. All calculations assume a 365-day year. The payables period is based on cost of goods sold.) Note: Round your answers to the nearest whole dollar. Liabilities and shareholders' equity Current liabilities: 71 days 33 days 2.2 times Accounts payable Short-term debt Total current liabilities Long-term debt Shareholders' equity Total liabilities and equity 5 65% 35 days $ $ 1,300,000 2,000,000 7,000,000arrow_forward
- The condensed financial statements of Blossom Company for the years 2019 and 2020 are presented below. BLOSSOM COMPANY Balance Sheets December 31 (in thousands) 2020 2019 Current assets Cash and cash equivalents $330 $360 Accounts receivable (net) 630 560 Inventory 580 510 Prepaid expenses 130 160 Total current assets 1,670 1590 Property, plant, and equipment (net) 410 380 Investments 170 170 530 510 Intangibles and other assets $2,780 $2,650 Total assets $980 $950 Current liabilities Long-term liabilities 600 500 Stockholders' equity-common 1,200 1,200 Total liabilities and stockholders equity $2780 $2,650 BLOSSOM COMPANY Income Statements For the Year Ended December 31 (in thousands) 2019 2020 $3,920 $3,580 Sales revenue Costs and expenses Cost of goods sold 1,130 1050 Selling & administrative expenses 2400 2,330 Interest expense 10 20 Total costs and expenses 3,540 3400 Income before income taxes 380 180 Income tax expense 152 72 $228 $108 Net incomearrow_forward4. A Company has Net Sales of 2,000,000 for 2020, Accounts Recitable for 500,000 in 2020, and Accounts Receivable of 350,000 in 2019. Calculate the Accounts Receivable Turnover Ratio.arrow_forward4. The following select financial statement information from Hogge Computing. Compute the accounts receivable turnover ratios and the number of days' sales in receivables ratios for 2021 and 2022 (round answers to two decimal places). Year 2020 2021 2022 2021: Net Credit Sales 2022: $1,557,200 $1,755,310 $1,965,170 Accounts Receivable Turnover Ratio: • Days' Sales: days Accounts Receivable Turnover Ratio: Days' Sales: days times times Ending Accounts Receivable $397,000 $465,200 $505,780arrow_forward
- Use the following financial statement information from Black Water Industries. BLACK WATER INDUSTRIES Ending Accounts Receivable Year Net Credit Sales 2017 $690,430 $335,250 2018 705,290 364,450 2019 770,500 406,650 A. Compute the accounts receivable turnover ratios for 2018 and 2019. Round your answers to two decimal places. 2018 times 2019 times B. Using the accounts receivable turnover, choose the statement that most closely describes the company's management of its receivables. a. The company's lending policies may be too strict. b. Collection efforts are not aggressive enough. There may be uncollectable receivables affecting the beginning and ending C. balances. d. All of the above statements may be correct. a b darrow_forwardam.101.arrow_forwardcalculate these (d) Current ratio :1 (e) Accounts receivable turnover times (f) Average collection period daysarrow_forward
arrow_back_ios
SEE MORE QUESTIONS
arrow_forward_ios
Recommended textbooks for you
 AccountingAccountingISBN:9781337272094Author:WARREN, Carl S., Reeve, James M., Duchac, Jonathan E.Publisher:Cengage Learning,
 Accounting Information SystemsAccountingISBN:9781337619202Author:Hall, James A.Publisher:Cengage Learning,
 Horngren's Cost Accounting: A Managerial Emphasis...AccountingISBN:9780134475585Author:Srikant M. Datar, Madhav V. RajanPublisher:PEARSON
 Intermediate AccountingAccountingISBN:9781259722660Author:J. David Spiceland, Mark W. Nelson, Wayne M ThomasPublisher:McGraw-Hill Education
 Financial and Managerial AccountingAccountingISBN:9781259726705Author:John J Wild, Ken W. Shaw, Barbara Chiappetta Fundamental Accounting PrinciplesPublisher:McGraw-Hill Education
Accounting
Accounting
ISBN:9781337272094
Author:WARREN, Carl S., Reeve, James M., Duchac, Jonathan E.
Publisher:Cengage Learning,
Accounting Information Systems
Accounting
ISBN:9781337619202
Author:Hall, James A.
Publisher:Cengage Learning,
Horngren's Cost Accounting: A Managerial Emphasis...
Accounting
ISBN:9780134475585
Author:Srikant M. Datar, Madhav V. Rajan
Publisher:PEARSON
Intermediate Accounting
Accounting
ISBN:9781259722660
Author:J. David Spiceland, Mark W. Nelson, Wayne M Thomas
Publisher:McGraw-Hill Education
Financial and Managerial Accounting
Accounting
ISBN:9781259726705
Author:John J Wild, Ken W. Shaw, Barbara Chiappetta Fundamental Accounting Principles
Publisher:McGraw-Hill Education