
Human Anatomy & Physiology (11th Edition)
11th Edition
ISBN: 9780134580999
Author: Elaine N. Marieb, Katja N. Hoehn
Publisher: PEARSON
expand_more
expand_more
format_list_bulleted
Related questions
Question

Transcribed Image Text:### Comparing Lobster Abundance and Price Trends
#### Task C
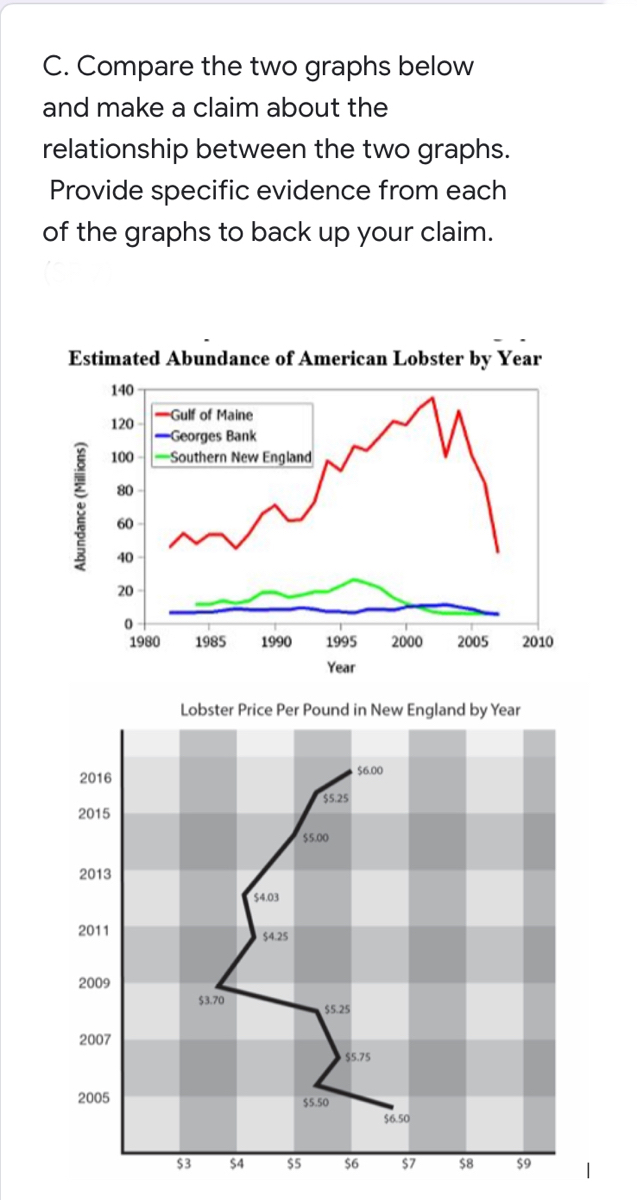
Compare the two graphs below and make a claim about the relationship between the two graphs. Provide specific evidence from each of the graphs to back up your claim.
#### Graph 1: Estimated Abundance of American Lobster by Year
This line graph illustrates the estimated abundance of American lobsters from three different regions: the Gulf of Maine, Georges Bank, and Southern New England, from 1980 to 2010.
- **Gulf of Maine (Red Line)**:
The abundance of lobsters in the Gulf of Maine shows a significant increase starting around the early 1980s, peaking in the early 2000s, followed by a sharp decline until 2010.
- **Georges Bank (Blue Line)**:
The abundance of lobsters in Georges Bank remains relatively constant and low over the entire period, with minimal fluctuations.
- **Southern New England (Green Line)**:
The abundance in Southern New England increased slightly from the mid-1980s, with some fluctuations, until about 2005, after which it remains stable.
#### Graph 2: Lobster Price Per Pound in New England by Year
This line graph shows the price per pound of lobsters in New England from 2005 to 2016.
- **2005-2007**:
Prices varied between $5.50 and $5.75 per pound.
- **2007-2009**:
A notable decrease in price is observed, reaching as low as $3.70 in 2009.
- **2009-2013**:
Prices show a steady increase, reaching $5 by 2013.
- **2013-2016**:
The price continues to rise, peaking at $6 per pound in 2016.
### Claim
There is an apparent relationship between the abundance of lobsters and their price per pound in New England over time. Specifically, when the abundance of lobsters in the Gulf of Maine starts to decline sharply around 2005 onwards, the price per pound in New England also starts to decrease significantly from 2007 to 2009. Following this period, as the abundance stabilizes, the price subsequently increases.
### Evidence
- **Abundance Decline and Price Drop**:
The abundance of lobsters in the Gulf of Maine begins to decline sharply around 2005. This
Expert Solution
This question has been solved!
Explore an expertly crafted, step-by-step solution for a thorough understanding of key concepts.

Step by stepSolved in 3 steps

Knowledge Booster

Similar questions
- Exam the graphing show the abundance index of 3 species in this system. Which of the following is true? OTTER O when kelp abundance is high urchin and otter abundace is also high when otter abundance is low kelp abundance is high URCHIN O when urchin abundance is low kelp and otter abundace is also low KELP 1930 1940 1950 1960 1970 1980 1990 2000 2010 2016 O when urchin abundance is high kelp Year and otter abundace is low INCLUDES HISTORICAL DATA Abundance Indexarrow_forwardD.A change in average temperature is a density-dependent factor because fewer organisms can acclimate to variations in temperature. Base your answers to questlons 14-16 on the Information below and on your knowledge of blology. Unless actions are taken to slow the decline of domesticated honeybees and augment [increase] their populations with wild bees, many fruits and vegetables may disappear from the food supply, said Claire Kremen, a conservation biologist at Princeton University in New Jersey... The honeybee decline, which is affecting domesticated and wild bee populations around the world, is mostly the result of diseases spread as a result of mites and other parasites as well as the spraying of crops with pesticides, scientists say. Source: "Bee Declines May Spell End of Some Fruits, Vegetables," National Geographic News, October 5, 2005 14. The decrease in the honeybee population is partly due to A. the use of pesticides B. the use of fertilizers C. a decrease in prey D. a…arrow_forwardA. why does it take 1000kg of grasses to make 100kg of lemmings? Said another way, why can’t you get 1000kg of lemmings from 1000kg of grasses? B. Give a rough estimate of the ratio of agricultural land needed to produce a hamburger compared to the same sized veggie burgerarrow_forward
arrow_back_ios
arrow_forward_ios
Recommended textbooks for you
- Human Anatomy & Physiology (11th Edition)BiologyISBN:9780134580999Author:Elaine N. Marieb, Katja N. HoehnPublisher:PEARSON
 Biology 2eBiologyISBN:9781947172517Author:Matthew Douglas, Jung Choi, Mary Ann ClarkPublisher:OpenStax
 Anatomy & PhysiologyBiologyISBN:9781259398629Author:McKinley, Michael P., O'loughlin, Valerie Dean, Bidle, Theresa StouterPublisher:Mcgraw Hill Education,
  Molecular Biology of the Cell (Sixth Edition)BiologyISBN:9780815344322Author:Bruce Alberts, Alexander D. Johnson, Julian Lewis, David Morgan, Martin Raff, Keith Roberts, Peter WalterPublisher:W. W. Norton & Company
 Laboratory Manual For Human Anatomy & PhysiologyBiologyISBN:9781260159363Author:Martin, Terry R., Prentice-craver, CynthiaPublisher:McGraw-Hill Publishing Co.
 Inquiry Into Life (16th Edition)BiologyISBN:9781260231700Author:Sylvia S. Mader, Michael WindelspechtPublisher:McGraw Hill Education
Human Anatomy & Physiology (11th Edition)
Biology
ISBN:9780134580999
Author:Elaine N. Marieb, Katja N. Hoehn
Publisher:PEARSON
Biology 2e
Biology
ISBN:9781947172517
Author:Matthew Douglas, Jung Choi, Mary Ann Clark
Publisher:OpenStax
Anatomy & Physiology
Biology
ISBN:9781259398629
Author:McKinley, Michael P., O'loughlin, Valerie Dean, Bidle, Theresa Stouter
Publisher:Mcgraw Hill Education,
Molecular Biology of the Cell (Sixth Edition)
Biology
ISBN:9780815344322
Author:Bruce Alberts, Alexander D. Johnson, Julian Lewis, David Morgan, Martin Raff, Keith Roberts, Peter Walter
Publisher:W. W. Norton & Company
Laboratory Manual For Human Anatomy & Physiology
Biology
ISBN:9781260159363
Author:Martin, Terry R., Prentice-craver, Cynthia
Publisher:McGraw-Hill Publishing Co.
Inquiry Into Life (16th Edition)
Biology
ISBN:9781260231700
Author:Sylvia S. Mader, Michael Windelspecht
Publisher:McGraw Hill Education