
Human Anatomy & Physiology (11th Edition)
11th Edition
ISBN: 9780134580999
Author: Elaine N. Marieb, Katja N. Hoehn
Publisher: PEARSON
expand_more
expand_more
format_list_bulleted
Related questions
Question

Transcribed Image Text:Certainly! Here's a transcription suitable for an educational website:
---
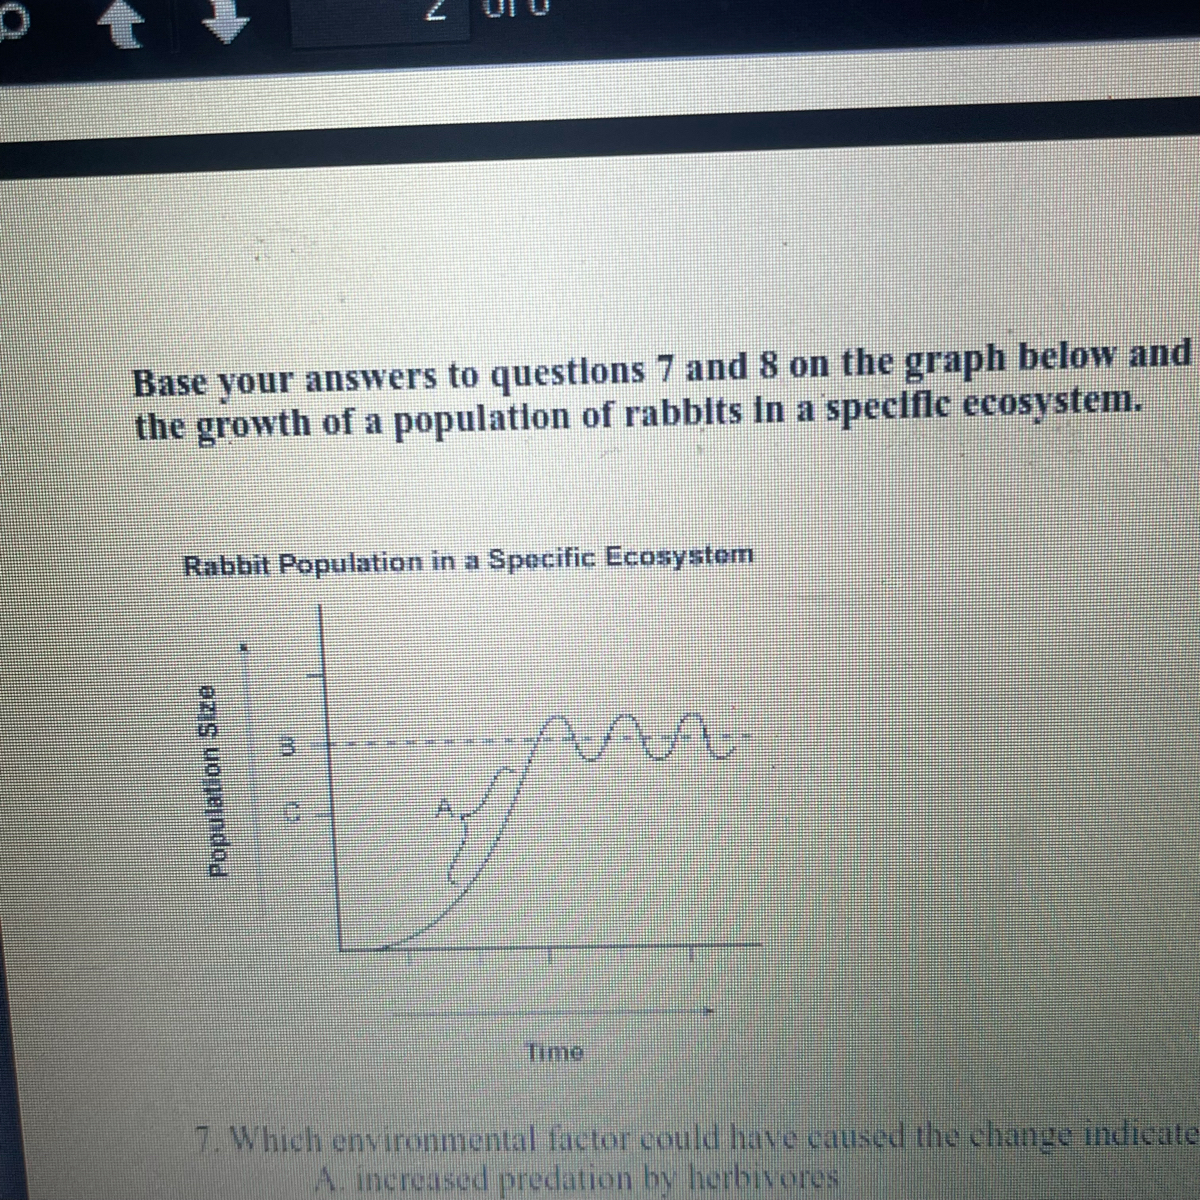
**Rabbit Population in a Specific Ecosystem**
*Overview:*
The graph titled "Rabbit Population in a Specific Ecosystem" displays the growth of a rabbit population over time in a natural habitat.
*Graph Details:*
- **Y-Axis (Vertical):** Represents the "Population Size" of rabbits.
- **X-Axis (Horizontal):** Represents "Time."
- **Curve A:** The graph shows an initial increase in the rabbit population, followed by fluctuations around a relatively stable level.
*Key Observations:*
- The population initially grows rapidly, indicating a period of favorable conditions or low predation.
- After reaching a certain population size, the graph shows oscillations, suggesting environmental checks such as predation, competition, or limited resources affecting population stability.
*Questions for Consideration:*
7. Which environmental factor could have caused the change indicated by curve A?
- A. Increased predation by herbivores
---
This transcription can help users understand the dynamics of rabbit population growth and the possible ecological factors influencing it.
![## Biology Assessment: Population Dynamics and Honeybee Decline
### Multiple Choice Question:
**13. Which of the following statements is correct?**
A. Population size of predators increases when their prey’s population is low.
B. Competition for resources is density-independent when food is plentiful.
C. Disease is density-dependent because spreading occurs more easily when a population is closer together.
D. A change in average temperature is a density-dependent factor because fewer organisms can acclimate to variations in temperature.
### Short Answer Questions:
**Base your answers to questions 14–16 on the information below and on your knowledge of biology.**
*...Unless actions are taken to slow the decline of domesticated honeybees and augment [increase] their populations with wild bees, many fruits and vegetables may disappear from the food supply, said Claire Kremen, a conservation biologist at Princeton University in New Jersey...*
*The honeybee decline, which is affecting domesticated and wild bee populations around the world, is mostly the result of diseases spread as a result of mites and other parasites as well as the spraying of crops with pesticides, scientists say...*
*Source: "Bee Declines May Spell End of Some Fruits, Vegetables".*](https://content.bartleby.com/qna-images/question/3cf57911-af59-4a98-b227-f142d4cd78df/6c0f6a40-25b5-4a86-901b-1aa1f0443514/dkbrrx_processed.jpeg)
Transcribed Image Text:## Biology Assessment: Population Dynamics and Honeybee Decline
### Multiple Choice Question:
**13. Which of the following statements is correct?**
A. Population size of predators increases when their prey’s population is low.
B. Competition for resources is density-independent when food is plentiful.
C. Disease is density-dependent because spreading occurs more easily when a population is closer together.
D. A change in average temperature is a density-dependent factor because fewer organisms can acclimate to variations in temperature.
### Short Answer Questions:
**Base your answers to questions 14–16 on the information below and on your knowledge of biology.**
*...Unless actions are taken to slow the decline of domesticated honeybees and augment [increase] their populations with wild bees, many fruits and vegetables may disappear from the food supply, said Claire Kremen, a conservation biologist at Princeton University in New Jersey...*
*The honeybee decline, which is affecting domesticated and wild bee populations around the world, is mostly the result of diseases spread as a result of mites and other parasites as well as the spraying of crops with pesticides, scientists say...*
*Source: "Bee Declines May Spell End of Some Fruits, Vegetables".*
Expert Solution
This question has been solved!
Explore an expertly crafted, step-by-step solution for a thorough understanding of key concepts.

This is a popular solution

Trending nowThis is a popular solution!

Step by stepSolved in 3 steps

Knowledge Booster

Similar questions
- 5. Which of the following total fertility rates would be most likely to reduce the worldwide human population to less than 7 billion people over the next century? A. a total fertility rate of 4.1 B. a total fertility rate of 3.5 C. a total fertility rate of 2.7 D. a total fertility rate of 2.2 E. a total fertility rate of 1.4arrow_forward3. Explain why it is common practice to also collect information about the physical environment when sampling populations: Quadrat 5 Quadrat 4 Quadrat 3 Quadrat 2 Quadrat 1 0 QUADRAT Height/m Light / arbitrary units Humidity / percent Temperature / °C 1 0.4 40 99 2 0.8 56 88 3 1.2 80 50 Percentage cover 68 72 76 14.3 14.2 Kichen 12.1 12.2 13 4 5 1.6 2.0 72 78 intain: 100 Red stem moss Fern moss Snake moss Star moss Eye brow moss Broad leaved star moss Tree moss Lichens (various species) 4. The figure (above) shows the changes in vegetation cover along a 2 m vertical transect up the trunk of an oak tree (Quercus). Changes in the physical factors light, humidity, and temperature along the same transect were also recorded. From what you know about the ecology of mosses and lichens, account for the observed vegetation distribution:arrow_forward14. Migratory wildebeest populations are limited mainly by factors that are: a. density-independent, top-down b. density-independent, bottom ap c. density-dependent, top-down d. density-dependent_bottom-up Because they are always moving and have to worry about their food rather than predators. asap pleasearrow_forward
- 1. The best example of a population in the list below is the a tiger salamander tadpoles in 2006. b nvertebrates in Elk Island National Park in June 2005. c Canadian darner dragonflies in Kerry Wood Nature Reserve on June 21, 2005.arrow_forwardWhich of the following is the best evidence that a mutualism is NOT a byproduct mutualism? Group of answer choices A. Each partner changes the help they give based on the amount of help from the other B. Each partner benefits from the relationship C. Each partner is a member of a different species D. The observed partners are nonkin E. The observed partners are kinarrow_forward5. Zebra mussels are an aquatic invasive species that are threatening the diversity and abundance of native species in the lake ecosystems of Alberta. Sylvan Lake is a beautiful recreational lake located in central Alberta. It has a total area of 43 km?. If the population of zebra mussels is estimated to be 128 mussels/200 km?, calculate the size of the zebra mussel population in Sylvan Lake. Show all work. Express your answer as a value rounded to one decimal place:arrow_forward
- 10: according to both diagrams the extinction of which one of the spider species would likely have a much bigger impact on community structure than the extinction of any of the others? A. Spider A B. Spider B C. Spider C D. It is not possible to predictarrow_forward3. In 1940 there were 12 whooping cranes in the population. In 1945, five years after hunting whooping cranes was made illegal, ecologists calculated the whooping crane population growth rate (X) at 1.2 and estimated the population size to be 30 individuals. Using the population growth rate calculated from 1940-1945, what would be the estimated population size for whooping cranes 20 years into the future (1965)? BIO 316 Study Topics and Practice problems for Exam 2 Please bring your own calculators. Be sure to show all work in order to get partial and full credit. 4. Calculate the Net Reproductive Rate, Mean Generation time, and intrinsic rate of increase using the fecundity table below for the Galapagos cactus finch: Age class lx mx lxmx 0 1 0 1 0.512 0.364 2 0.279 0.187 3 0.279 1.438 4 0.209 0.833 10 567890 0.209 0.5 0.209 0.833 0.209 0.25 0.209 3.333 0.139 0.125 0.07 0 11 0.07 0 12 0.07 3.5 13 0 xlxmx 3arrow_forward4. Identify the time interval during which each of the following occurred: the population grew (graph is rising) from week the population grew the fastest (graph is steepest) from week the population size remained the same (graph is horizontal) from week week the population decreased (graph is falling) from week 5. Predict the number of beetles present at the following weeks: week 5 - week 9 - beetles 6. Could this data be presented as a bar graph ? What would be the disadvantage ? to week 8. Design a simple experiment to test this hypothesis. 11 to week 7. Construct a hypothesis to explain why the beetle population declines. to week beetles toarrow_forward
arrow_back_ios
arrow_forward_ios
Recommended textbooks for you
- Human Anatomy & Physiology (11th Edition)BiologyISBN:9780134580999Author:Elaine N. Marieb, Katja N. HoehnPublisher:PEARSON
 Biology 2eBiologyISBN:9781947172517Author:Matthew Douglas, Jung Choi, Mary Ann ClarkPublisher:OpenStax
 Anatomy & PhysiologyBiologyISBN:9781259398629Author:McKinley, Michael P., O'loughlin, Valerie Dean, Bidle, Theresa StouterPublisher:Mcgraw Hill Education,
  Molecular Biology of the Cell (Sixth Edition)BiologyISBN:9780815344322Author:Bruce Alberts, Alexander D. Johnson, Julian Lewis, David Morgan, Martin Raff, Keith Roberts, Peter WalterPublisher:W. W. Norton & Company
 Laboratory Manual For Human Anatomy & PhysiologyBiologyISBN:9781260159363Author:Martin, Terry R., Prentice-craver, CynthiaPublisher:McGraw-Hill Publishing Co.
 Inquiry Into Life (16th Edition)BiologyISBN:9781260231700Author:Sylvia S. Mader, Michael WindelspechtPublisher:McGraw Hill Education
Human Anatomy & Physiology (11th Edition)
Biology
ISBN:9780134580999
Author:Elaine N. Marieb, Katja N. Hoehn
Publisher:PEARSON
Biology 2e
Biology
ISBN:9781947172517
Author:Matthew Douglas, Jung Choi, Mary Ann Clark
Publisher:OpenStax
Anatomy & Physiology
Biology
ISBN:9781259398629
Author:McKinley, Michael P., O'loughlin, Valerie Dean, Bidle, Theresa Stouter
Publisher:Mcgraw Hill Education,
Molecular Biology of the Cell (Sixth Edition)
Biology
ISBN:9780815344322
Author:Bruce Alberts, Alexander D. Johnson, Julian Lewis, David Morgan, Martin Raff, Keith Roberts, Peter Walter
Publisher:W. W. Norton & Company
Laboratory Manual For Human Anatomy & Physiology
Biology
ISBN:9781260159363
Author:Martin, Terry R., Prentice-craver, Cynthia
Publisher:McGraw-Hill Publishing Co.
Inquiry Into Life (16th Edition)
Biology
ISBN:9781260231700
Author:Sylvia S. Mader, Michael Windelspecht
Publisher:McGraw Hill Education