
FINANCIAL ACCOUNTING
10th Edition
ISBN: 9781259964947
Author: Libby
Publisher: MCG
expand_more
expand_more
format_list_bulleted
Related questions
Concept explainers
Question

Transcribed Image Text:### Cost of Goods Sold Calculation for Companies B, M, O, and S
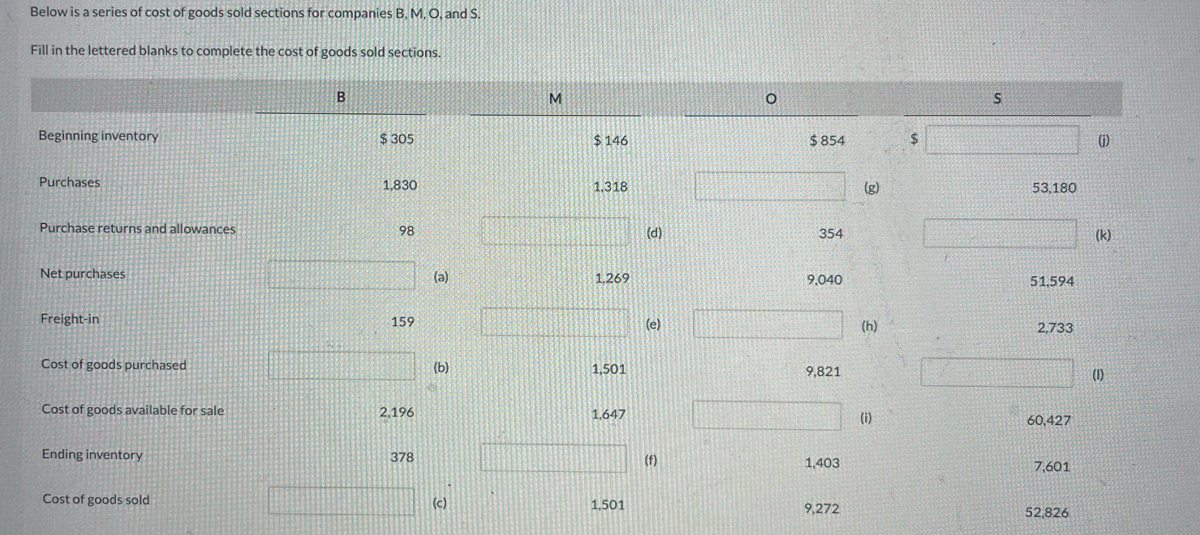
Below is a series of cost of goods sold sections for companies B, M, O, and S. Fill in the lettered blanks to complete the cost of goods sold sections.
| | B | M | O | S |
|--------------------|----------|---------|---------|---------|
| Beginning inventory| $305 | $146 | $854 | $(j) |
| Purchases | 1,830 | 1,318 | $(g) | 53,180 |
| Purchase returns and allowances | 98 | $(d) | 354 | $(k) |
| Net purchases | $(a) | 1,269 | 9,040 | 51,594 |
| Freight-in | 159 | $(e) | $(h) | 2,733 |
| Cost of goods purchased | $(b) | 1,501 | 9,821 | $(l) |
| Cost of goods available for sale | 2,196 | 1,647 | $(i) | 60,427 |
| Ending inventory | 378 | $(f) | 1,403 | 7,601 |
| Cost of goods sold | $(c) | 1,501 | 9,272 | 52,826 |
**Explanation of the Grid Layout:**
- **Columns**: Each column represents a different company (B, M, O, and S).
- **Rows**: Each row categorizes a different aspect of the cost of goods sold calculation:
- Beginning Inventory
- Purchases
- Purchase Returns and Allowances
- Net Purchases (Purchases - Purchase Returns and Allowances)
- Freight-in
- Cost of Goods Purchased (Net Purchases + Freight-in)
- Cost of Goods Available for Sale (Beginning Inventory + Cost of Goods Purchased)
- Ending Inventory
- Cost of Goods Sold (Cost of Goods Available for Sale - Ending Inventory)
### Graphical/Diagram Explanation:
There are no graphs or diagrams included in this content. The worksheet provided is a table structured to allow the reader to fill in specific blanks designated by letters (a), (b), (c), etc., to
Expert Solution
This question has been solved!
Explore an expertly crafted, step-by-step solution for a thorough understanding of key concepts.

Step by stepSolved in 3 steps with 12 images

Knowledge Booster


Learn more about
Need a deep-dive on the concept behind this application? Look no further. Learn more about this topic, accounting and related others by exploring similar questions and additional content below.Similar questions
- Required:Hemming uses a periodic inventory system. (a) Determine the costs assigned to ending inventory and to cost of goods sold using FIFO.arrow_forwardCalculate a) cost of goods sold, b) ending inventory, and c) gross margin for A76 Company, considering the following transactions under three different cost allocation methods and using perpetual inventory updating. Provide calculations for first-in, first-out (FIFO). Numberof Units Unit Cost Sales Beginning Inventory 260 $140 Sold 160 $180 Purchased 510 143 Sold 400 182 Purchased 420 150 Sold 370 184 Ending Inventory 260 FIFO (perpetual) Inventory Cost of Goods Purchased Cost of Goods Sold Cost of Inventory Remaining Numberof Units Unit Cost Total Cost Numberof Units Unit Cost Total Cost Numberof Units Unit Cost Total Cost Beginning fill in the blank 1 $fill in the blank 2 $fill in the blank 3 Sale fill in the blank 4 $fill in the blank 5 $fill in the blank 6 fill in the blank 7 fill in the blank 8 fill in the blank 9 Purchase fill in the blank 10 $fill in the…arrow_forwardb) Complete the following table to show how FOB terms apply to merchandise inventory purchased by a merchandiser. FOB Term When does the title to the Who pays the goods transfer to the buyer? freight? Shipping Point Destination c) Journalize the following transaction for a merchandiser that uses the perpetual inventory system. Sold goods for cash of $1,200 and on account of $800. Total cost $1,500. Omit explanations.arrow_forward
- The following data represent the beginning inventory and, in order of occurrence, the purchases and sales of Per Beginning Inventory Sale No. 1 Purchase No. 1 Sale No. 2 Purchase No. 2 Totals Select one: O Units Unit Cost Total Cost Units Sold 50 $124 $6,200 A. $5,952 B. $4,320 C. $4,800 D. $4,224 30 40 120 100 88 3,000 40 32 Assuming Petroni, Inc. uses FIFO perpetual inventory procedures, the ending inventory cost is: 3,520 $12,720 72arrow_forwardSuppose that Ivanhoe uses a periodic inventory system and has these account balances: Purchases $571,000; Purchase Returns and Allowances $11,800; Purchases Discounts $9,100; and Freight-In $14,300. Determine net purchases and cost of goods purchased. Net purchases tA Cost of goods purchased $arrow_forwardJayarrow_forward
- Please help me with required 1 and 2.arrow_forwardCalculate the missing information for the purchase. Item SellingPrice(in $) SalesTaxRate SalesTax(in $) ExciseTax Rate ExciseTax TotalPurchase Price Book $ 8 $ 0 0 $19.44arrow_forwardThe cost of goods sold (Using the FIFO method) $.__________________________ The of cost of the ending Inventory (using the LIFO method) $____________________ The cost of Goods sold (Using the LIFO method) $_______________________________arrow_forward
- 25. Cairns owns 75 percent of the voting stock of Hamilton, Inc. The parent's interest was acquired several years ago on the date that the subsidiary was formed. Consequently, no goodwill or other allocation was recorded in connection with the acquisition. Cairns uses the equity method in its internal records to account for its investment in Hamilton. On January 1, 2020, Hamilton sold $1,000,000 in 10-year bonds to the public at 105. The bonds had a cash interest rate of 9 percent payable every December 31. Cairns acquired 40 percent of these bonds at 96 percent of face value on January 1, 2022. Both companies utilize the straight-line method of amortization. Prepare the consolidation worksheet entries to recognize the effects of the intra-entity bonds at each of the following dates. a. December 31, 2022 b. December 31, 2023 c. December 31, 2024arrow_forwardFor each transaction of Sealy Company, (a) determine whether or not Sealy owns the goods during transit. (b) If Sealy is responsible for transportation costs, record the entry for shipping costs assuming they are paid in cash and the perpetual inventory system is used. journal entry worksheet Purchased goods FOB shipping point. Transportation costs are $690. Sold goods FOB destination. Transportation costs are $290. Sold goods FOB shipping point. Transportation costs are $440. Purchased goods FOB destination. Transportation costs are $170.arrow_forwardHeer Don't upload any image pleasearrow_forward
arrow_back_ios
SEE MORE QUESTIONS
arrow_forward_ios
Recommended textbooks for you
 AccountingAccountingISBN:9781337272094Author:WARREN, Carl S., Reeve, James M., Duchac, Jonathan E.Publisher:Cengage Learning,
 Accounting Information SystemsAccountingISBN:9781337619202Author:Hall, James A.Publisher:Cengage Learning,
 Horngren's Cost Accounting: A Managerial Emphasis...AccountingISBN:9780134475585Author:Srikant M. Datar, Madhav V. RajanPublisher:PEARSON
 Intermediate AccountingAccountingISBN:9781259722660Author:J. David Spiceland, Mark W. Nelson, Wayne M ThomasPublisher:McGraw-Hill Education
 Financial and Managerial AccountingAccountingISBN:9781259726705Author:John J Wild, Ken W. Shaw, Barbara Chiappetta Fundamental Accounting PrinciplesPublisher:McGraw-Hill Education
Accounting
Accounting
ISBN:9781337272094
Author:WARREN, Carl S., Reeve, James M., Duchac, Jonathan E.
Publisher:Cengage Learning,
Accounting Information Systems
Accounting
ISBN:9781337619202
Author:Hall, James A.
Publisher:Cengage Learning,
Horngren's Cost Accounting: A Managerial Emphasis...
Accounting
ISBN:9780134475585
Author:Srikant M. Datar, Madhav V. Rajan
Publisher:PEARSON
Intermediate Accounting
Accounting
ISBN:9781259722660
Author:J. David Spiceland, Mark W. Nelson, Wayne M Thomas
Publisher:McGraw-Hill Education
Financial and Managerial Accounting
Accounting
ISBN:9781259726705
Author:John J Wild, Ken W. Shaw, Barbara Chiappetta Fundamental Accounting Principles
Publisher:McGraw-Hill Education