FINANCIAL ACCOUNTING
10th Edition
ISBN: 9781259964947
Author: Libby
Publisher: MCG
expand_more
expand_more
format_list_bulleted
Question

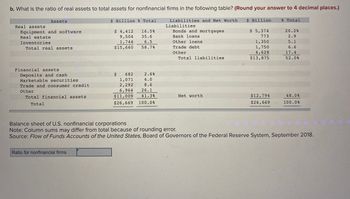
Transcribed Image Text:b. What is the ratio of real assets to total assets for nonfinancial firms in the following table? (Round your answer to 4 decimal places.)
Liabilities and Net Worth
Liabilities
Bonds and mortgages
Bank loans
Other loans
Trade debt
Other
Assets
Real assets
Equipment and software
Real estate
Inventories
Total real assets
Financial assets
Deposits and cash
Marketable securities
Trade and consumer credit
Other
Total financial assets
Total
$ Billion % Total
$ 4,412
9,504
1,744
16.5%
35.6
6.5
$15,660
58.7%
Ratio for nonfinancial firms
2.6%
4.0
8.6
26.1
41.3%
$ 682
1,071
2,292
6,964
$11,009
$26,669 100.0%
Total liabilities
Net worth
$ Billion
$ 5,374
773
1,350
1,750
4,628
$13,875
$12,794
$26,669
% Total
20.2%
2.9
5.1
6.6
17.4
52.0%
48.0%
100.0%
Balance sheet of U.S. nonfinancial corporations
Note: Column sums may differ from total because of rounding error.
Source: Flow of Funds Accounts of the United States, Board of Governors of the Federal Reserve System, September 2018.

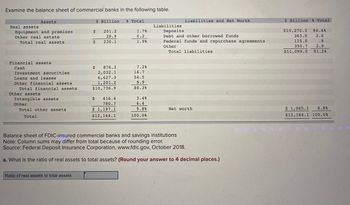
Transcribed Image Text:Examine the balance sheet of commercial banks in the following table.
$ Billion % Total
201.2
28.9
230.1
Assets
Real assets
Equipment and premises
Other real estate
Total real assets
Financial assets
Cash
Investment securities
Loans and leases
Other financial assets
Total financial assets
Other assets
Intangible assets
Other
Total other assets
Total
$
Ratio of real assets to total assets
$
$ 876.3
2,032.1
6,627.3
1,201.2
$10,736.9
$ 416.4
780.7
$ 1,197.1
$12,164.1
1.7%
0.2
1.9%
7.2%
16.7
54.5
9.9
88.3%
3.4%
6.4
9.8%
100.0%
Liabilities
Deposits
Liabilities and Net Worth
Debt and other borrowed funds
Federal funds and repurchase agreements
Other
Total liabilities
Net worth
Balance sheet of FDIC-insured commercial banks and savings institutions
Note: Column sums may differ from total because of rounding error.
Source: Federal Deposit Insurance Corporation, www.fdic.gov, October 2018.
a. What is the ratio of real assets to total assets? (Round your answer to 4 decimal places.)
$ Billion % Total
84.4%
3.0
.9
2.9
$11,099.0 91.2%
$10,270.3
363.0
115.0
350.7
$ 1,065.1 8.8%
$12,164.1 100.0%
Expert Solution
arrow_forward
Step 1
Real assets are the types of assets that include the building, equipment, and land owned/leased by the company. These assets are helpful in carrying out production activities. The production of goods takes place with the help of these assets.
Trending nowThis is a popular solution!
Step by stepSolved in 3 steps

Knowledge Booster
Learn more about
Need a deep-dive on the concept behind this application? Look no further. Learn more about this topic, accounting and related others by exploring similar questions and additional content below.Similar questions
- What is the financial performance summary for this balance sheet? BALANCE SHEET INCOME STATEMENT ($ in millions) ($ in millions) ASSETS LIABILITIES Revenue 28,681.10 Cash & Marketable Securities 449.90 Accounts Payable 1,611.20 Cost Of Goods Sold 20,768.80 Accounts Receivable 954.80 Salaries Payable 225.20 Gross Profit 7,912.30 Inventories 3,645.20 Other Current Liabilities 1,118.80 Other Current Assets 116.60 Total Current Liabilities 2,955.20 Operating Expenses: Total Current Assets 5,166.50 Selling, General & Admin. 5,980.80 Other Liabilities 693.40 Depreciation 307.30 Machinery & Equipment 1,688.90 Operating income 1,624.20 Land 1,129.70 Total Liabilities 3,648.60 Buildings 2,348.40 Interest - Depreciation (575.60) SHAREHOLDER'S EQUITY Other Expense (Income) (13.10) Property, Plant & Equip. - Net…arrow_forwardQ-1 A security analyst calculates the following ratios for the two banks: i. How should the financial analyst evaluate the financial health of the two banks? ii. Discuss each ratio and which bank would you prefer and why?arrow_forward8. Compute the acid-test (quick ratio) ratio using the following data: highly liquid assets cash, AR, ST investment A) B) C) D) 1.15 1.24 1.33 1.86 Answer: B Cash Inventory Accounts Receivable Current ratio $115,000 105,000 55,000 2.00arrow_forward
- ! Required information Problem 12-6A (Algo) Use ratios to analyze risk and profitability (LO12-3, 12-4) [The following information applies to the questions displayed below.] Income statements and balance sheets data for Virtual Gaming Systems are provided below. Net sales Cost of goods sold Gross profit Expenses: VIRTUAL GAMING SYSTEMS Income Statements For the Years Ended December 31 2025 $3,495,000 2,477,000 1,018,000 Operating expenses Depreciation expense Loss on sale of land Interest expense Income tax expense Total expenses Net income 952,000 27,000 16,500 7,700 1,003, 200 14,800 2024 $3,021,000 1,947,000 1,074,000 855,000 25,500 7,700 13,500 46,500 948, 200 125,800arrow_forward1.Calculate the trends in the sales and cost of sales and comment on the information disclosed by your analysis.arrow_forwardbased on the ratios what can you say about the company's liquidity? Is it liquid enough to convert its asset in to cash immediately or within one year?arrow_forward
- Calculate the dividend payout ratio.arrow_forwardb. What is the ratio of real assets to total assets for nonfinancial firms in the following table? (Round your answer to 4 decimal places.) $ Billion Liabilities and Net Worth Liabilities Bonds and mortgages Bank loans $ 5,364 758 1,338 Other loans Trade debt 1,738 Other 4,608 $13,806 Assets Real assets Equipment and software Real estate Inventories Total real assets Financial assets Deposits and cash Marketable securities Trade and consumer credit Other Total financial assets Total $ Billion % Total $ 4,402 16.4% 36.3 9,749 1,734 6.5 $15,885 59.1% Ratio for nonfinancial firms $ 677 2.5% 1,056 3.9 2,282 8.5 6,968 25.9 $10,983 40.9% $26,868 100.0% Total liabilities Net worth $13,062 $26,868 % Total 20.0% 2.8 5.0 6.5 17.2 51.4% 48.6% 100.0% Balance sheet of U.S. nonfinancial corporations Note: Column sums may differ from total because of rounding error. Source: Flow of Funds Accounts of the United States, Board of Governors of the Federal Reserve System, September 2018.arrow_forward36 Ratio Analysis - Explain how the following ratios are calculated and what the ratio indicates. Include how these ratios provide useful information related to accounting decision making topics such as efficiency (collecting amounts owed to the firm, using the assets well, getting items to market, etc.), liquidity (ability to pay current debts), solvency (ability to pay long term or all debts) Asset Turnover Return on Assets Current Ratio Accounts Receivable Turnover Average Collection Period Debt Ratio Days’ sales in Inventory Gross Profit Percentage Return on Sales Ratioarrow_forward
- Based on the financial statements provided, compute the following financial ratios. Show your workings and round your figures to 2 decimal places. Ratio 2020 2019 Current Ratio Quick Ratio Debt Ratio (%)arrow_forwardQ3-1 What are the five groups of financial ratios? Give two or three examples of each kind. Q3-2 Explain the kind of information the following financial ratios provide about a firm? A. Quick ratio B. Cash ratio C. Total asset turnover D. Equity multiplier E. Time interest earned ratio F. Profit margin G. Return on assets H. Return on equity 1. Price / earnings ratioarrow_forwardThe following ratios gauge a bank’s leverage EXCEPT* Bills Payable to Capital Accounts Capital Accounts to Loans Debt to Equity Deposits to Capital Accounts Net Income to Total Equityarrow_forward
arrow_back_ios
SEE MORE QUESTIONS
arrow_forward_ios
Recommended textbooks for you

 AccountingAccountingISBN:9781337272094Author:WARREN, Carl S., Reeve, James M., Duchac, Jonathan E.Publisher:Cengage Learning,
 Accounting Information SystemsAccountingISBN:9781337619202Author:Hall, James A.Publisher:Cengage Learning,
 Horngren's Cost Accounting: A Managerial Emphasis...AccountingISBN:9780134475585Author:Srikant M. Datar, Madhav V. RajanPublisher:PEARSON
 Intermediate AccountingAccountingISBN:9781259722660Author:J. David Spiceland, Mark W. Nelson, Wayne M ThomasPublisher:McGraw-Hill Education
 Financial and Managerial AccountingAccountingISBN:9781259726705Author:John J Wild, Ken W. Shaw, Barbara Chiappetta Fundamental Accounting PrinciplesPublisher:McGraw-Hill Education


Accounting
Accounting
ISBN:9781337272094
Author:WARREN, Carl S., Reeve, James M., Duchac, Jonathan E.
Publisher:Cengage Learning,

Accounting Information Systems
Accounting
ISBN:9781337619202
Author:Hall, James A.
Publisher:Cengage Learning,

Horngren's Cost Accounting: A Managerial Emphasis...
Accounting
ISBN:9780134475585
Author:Srikant M. Datar, Madhav V. Rajan
Publisher:PEARSON

Intermediate Accounting
Accounting
ISBN:9781259722660
Author:J. David Spiceland, Mark W. Nelson, Wayne M Thomas
Publisher:McGraw-Hill Education

Financial and Managerial Accounting
Accounting
ISBN:9781259726705
Author:John J Wild, Ken W. Shaw, Barbara Chiappetta Fundamental Accounting Principles
Publisher:McGraw-Hill Education