
Essentials Of Investments
11th Edition
ISBN: 9781260013924
Author: Bodie, Zvi, Kane, Alex, MARCUS, Alan J.
Publisher: Mcgraw-hill Education,
expand_more
expand_more
format_list_bulleted
Related questions
Concept explainers
Topic Video
Question
Calculate the dividend payout ratio.
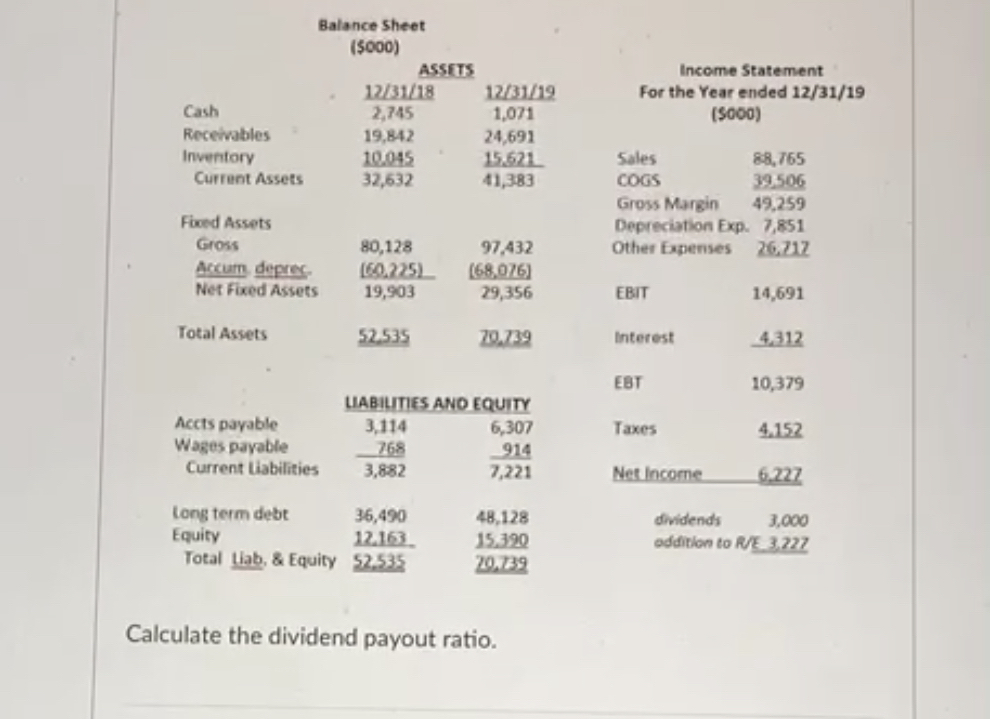

Transcribed Image Text:Cash
Receivables
Inventory
Current Assets
Fixed Assets
Gross
Accum, deprec
Net Fixed Assets
Total Assets
Balance Sheet
(5000)
Accts payable
Wages payable
Current Liabilities
Long term debt
Equity
12/31/18
2,745
19,842
10.045
32,632
80,128
19,903
52.535
ASSETS
36,490
12.163
Total Liab, & Equity 52.535
12/31/19
1,071
24,691
15.621
41,383
97,432
(68,076)
29,356
70.739
LIABILITIES AND EQUITY
3,114
768
3,882
6,307
914
7,221
48,128
15.390
20.739
Calculate the dividend payout ratio.
Income Statement
For the Year ended 12/31/19
(5000)
Sales
COGS
Gross Margin
88,765
39.506
49,259
Depreciation Exp. 7,851
Other Expenses 26.717
EBIT
Interest
EBT
Taxes
Net Income
14,691
4,312
10,379
4.152
6.227
dividends
3,000
addition to R/E 3,227
Expert Solution
This question has been solved!
Explore an expertly crafted, step-by-step solution for a thorough understanding of key concepts.

Step by stepSolved in 2 steps

Knowledge Booster


Learn more about
Need a deep-dive on the concept behind this application? Look no further. Learn more about this topic, finance and related others by exploring similar questions and additional content below.Similar questions
arrow_back_ios
SEE MORE QUESTIONS
arrow_forward_ios
Recommended textbooks for you
- Essentials Of InvestmentsFinanceISBN:9781260013924Author:Bodie, Zvi, Kane, Alex, MARCUS, Alan J.Publisher:Mcgraw-hill Education,


 Foundations Of FinanceFinanceISBN:9780134897264Author:KEOWN, Arthur J., Martin, John D., PETTY, J. WilliamPublisher:Pearson,
 Fundamentals of Financial Management (MindTap Cou...FinanceISBN:9781337395250Author:Eugene F. Brigham, Joel F. HoustonPublisher:Cengage Learning
 Corporate Finance (The Mcgraw-hill/Irwin Series i...FinanceISBN:9780077861759Author:Stephen A. Ross Franco Modigliani Professor of Financial Economics Professor, Randolph W Westerfield Robert R. Dockson Deans Chair in Bus. Admin., Jeffrey Jaffe, Bradford D Jordan ProfessorPublisher:McGraw-Hill Education
Essentials Of Investments
Finance
ISBN:9781260013924
Author:Bodie, Zvi, Kane, Alex, MARCUS, Alan J.
Publisher:Mcgraw-hill Education,
Foundations Of Finance
Finance
ISBN:9780134897264
Author:KEOWN, Arthur J., Martin, John D., PETTY, J. William
Publisher:Pearson,
Fundamentals of Financial Management (MindTap Cou...
Finance
ISBN:9781337395250
Author:Eugene F. Brigham, Joel F. Houston
Publisher:Cengage Learning
Corporate Finance (The Mcgraw-hill/Irwin Series i...
Finance
ISBN:9780077861759
Author:Stephen A. Ross Franco Modigliani Professor of Financial Economics Professor, Randolph W Westerfield Robert R. Dockson Deans Chair in Bus. Admin., Jeffrey Jaffe, Bradford D Jordan Professor
Publisher:McGraw-Hill Education