
MATLAB: An Introduction with Applications
6th Edition
ISBN: 9781119256830
Author: Amos Gilat
Publisher: John Wiley & Sons Inc
expand_more
expand_more
format_list_bulleted
Related questions
Concept explainers
Topic Video
Question
1. Microprocessor chips coming off of a Fab line are tested to divide them into 3 speed
categories: 2GHz, 3GHz, and 6GHz. 900 chips are tested with 200 being placed in the
2GHz category, 400 being placed in the 3GHz category, and 300 being placed in the
6GHz category.
a) What is the average speed of this batch of chips? Show your work clearly.
b) If you are given that the standard deviation in the chip speed is equal to 0.5 GHz,
determine the 99% confidence interval CONF γ.
Use the following table:
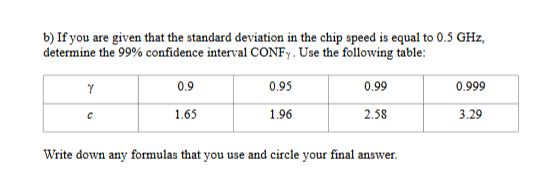

Transcribed Image Text:b) If you are given that the standard deviation in the chip speed is equal to 0.5 GHz
determine the 99% confidence interval CONFY. Use the following table:
0.99
0.9
0.95
0.999
1.65
1.96
2.58
3.29
C
Write down any formulas that you use and circle your final answer.
Expert Solution
This question has been solved!
Explore an expertly crafted, step-by-step solution for a thorough understanding of key concepts.

This is a popular solution

Trending nowThis is a popular solution!

Step by stepSolved in 5 steps with 3 images

Knowledge Booster


Learn more about
Need a deep-dive on the concept behind this application? Look no further. Learn more about this topic, statistics and related others by exploring similar questions and additional content below.Similar questions
- To illustrate the effects of driving under the influence (DUI) of alcohol, a police officer brought a DUI simulator to a local high school. Student reaction time in an emergency was measured with unimpaired vision and also while wearing a pair of special goggles to simulate the effects of alcohol on vision. For a random sample of nine teenagers, the time (in seconds) required to bring the vehicle to a stop from a speed of 60 miles per hour was recorded. Complete parts (a) and (b). Note: A normal probability plot and boxplot of the data indicate that the differences are approximately normally distributed with no outliers. Click the icon to view the data table. (a) Whether the student had unimpaired vision or wore goggles first was randomly selected. Why is this a good idea in designing the experiment? A. This is a good idea in designing the experiment because it controls for any "learning" that may occur in using the simulator. B. This is a good idea in designing the experiment because…arrow_forwardIn the table below is a column of masses for various individuals. 20 Kg (kllograms), for instance, is a typical mass for a young child while 80 kg Is characteristic of an adult's mass, If you were to travel to the Moon, your weight would change but your mass would remain the same. Roughly speaking, mass is a measure of the amount of "stuff" you're made of (matter). In the United States we commonly measure weight using the English pound. Another common unit for measuring weight is the Newton. The second column in the table shows the corresponding weight, in Newtons, for each individual. These are the weights on Earth. Plot each pair of numbers as an ordered pair on the graph. Use the vertical ("y") axis for the weights and the horizontal ("x") axis for mass. Label your axes. Draw a best fit line through the points and measure the slope of this line. On your plot, mark and circle the points you use to determine the slope. The slope gives you the "weight per unit mass" here on Earth. In…arrow_forwardA researcher is interested in testing the relationship between smoking and BMI (kg/m2) in adults aged 30-45. In order to test this association, the researcher divides smoking into currently more than a pack a day, currently less than a pack a day, and never smokers. The following table represents the BMIs for each participant enrolled by their respective smoking category. Current Smoker (≥1pack/day) Current Smoker (<1 pack/day Never Smoked 26.7 29.4 22.1 29.4 28.6 30.4 24.3 27.4 21.3 28.4 23.2 26.4 21.6 20.1 19.7 27.4 20.6 19.8 26.8 19.7 21.6 36.4 19.6 22.3 31.5 21.6 24.3 27.4 21.5 *Continue as though all assumptions for ANOVA are met. A) Calculate the MSW and MSB for the data represented above. B) Carry out a formal test for a one-way analysis of variance among the groups and interpret your results.arrow_forward
- Hello, Please help me with all subparts of this answer for a study guide.arrow_forwardThe defending attorney Mr. Justin Case was interested in how a lengthy trial could affect howlong a jury would deliberate on a case (and see if he should just cut to the chase). He observed asample of courtroom trials and noticed the following:Days inTrial (X) 5 2 6 4 5 6 2 4 2 1 HoursDeliberation (Y) 4 4 1 3 1 3 9 2 3 7 5) Mr. Case’s client’s most recent case took 10 days to complete. How long should he \ predict the jury deliberation will take?arrow_forwardAnswer all questions. Please do not copy from other posts:arrow_forward
- For the following situations, identify the type of variable (qualitative, nominal, ordinal, quantitative, discrete, continuous, interval, ratio), multiple types may apply. 1) Data of weight gain of rats fed only junk food for four weeks in an experiment. 2) Data collected from the order that students finsih their exam. 3) Time it takes for a car battery to diearrow_forwardb) Calculate the fitness of a population with allele frequency x = 0.4. W = Give your answer rounded to 2 decimal places. Find the allele frequency, x, of a population with fitness 0.2. X =arrow_forwardPlease Helparrow_forward
- A) Y=1566.67x + 1716.67 B) Y= 3x + 2000 C) Y= 4700x + 1500 D) Y= x + 1700arrow_forwardYou Got Gas have developed a new type of fuel additive that supposedly increases car speed. Before they put it out on the market, however, they need to test if it really is a difference compared to standard fuel. So, they took 6 vehicles and calculated the time it takes to for them to drive 1 mile going as fast as they can. They received the following data: Car ID# Course time (standard fuel in minutes) Course time (w/ additive in minutes) 1 35 27 2 40 35 3 25 27 4 40 39 5 95 94 6 32 18 6. What is the null and research hypothesis for this study? 7. What type of statistical test should we use to compare means (z-test, independent t-test, dependent t-test, or ANOVA)? Why? 8. What are the degrees of freedom? What are the critical values for that statistical test with this data at α = 0.05? α = 0.01? 9. Comparing the groups, is there a significant difference at α = 0.05 in lap time between eating the name bran and when they ate Dog Go? 10. How would the researcher…arrow_forward
arrow_back_ios
arrow_forward_ios
Recommended textbooks for you
- MATLAB: An Introduction with ApplicationsStatisticsISBN:9781119256830Author:Amos GilatPublisher:John Wiley & Sons Inc
 Probability and Statistics for Engineering and th...StatisticsISBN:9781305251809Author:Jay L. DevorePublisher:Cengage Learning
 Statistics for The Behavioral Sciences (MindTap C...StatisticsISBN:9781305504912Author:Frederick J Gravetter, Larry B. WallnauPublisher:Cengage Learning
  Elementary Statistics: Picturing the World (7th E...StatisticsISBN:9780134683416Author:Ron Larson, Betsy FarberPublisher:PEARSON
 The Basic Practice of StatisticsStatisticsISBN:9781319042578Author:David S. Moore, William I. Notz, Michael A. FlignerPublisher:W. H. Freeman
 Introduction to the Practice of StatisticsStatisticsISBN:9781319013387Author:David S. Moore, George P. McCabe, Bruce A. CraigPublisher:W. H. Freeman
MATLAB: An Introduction with Applications
Statistics
ISBN:9781119256830
Author:Amos Gilat
Publisher:John Wiley & Sons Inc
Probability and Statistics for Engineering and th...
Statistics
ISBN:9781305251809
Author:Jay L. Devore
Publisher:Cengage Learning
Statistics for The Behavioral Sciences (MindTap C...
Statistics
ISBN:9781305504912
Author:Frederick J Gravetter, Larry B. Wallnau
Publisher:Cengage Learning
Elementary Statistics: Picturing the World (7th E...
Statistics
ISBN:9780134683416
Author:Ron Larson, Betsy Farber
Publisher:PEARSON
The Basic Practice of Statistics
Statistics
ISBN:9781319042578
Author:David S. Moore, William I. Notz, Michael A. Fligner
Publisher:W. H. Freeman
Introduction to the Practice of Statistics
Statistics
ISBN:9781319013387
Author:David S. Moore, George P. McCabe, Bruce A. Craig
Publisher:W. H. Freeman