
MATLAB: An Introduction with Applications
6th Edition
ISBN: 9781119256830
Author: Amos Gilat
Publisher: John Wiley & Sons Inc
expand_more
expand_more
format_list_bulleted
Related questions
Topic Video
Question
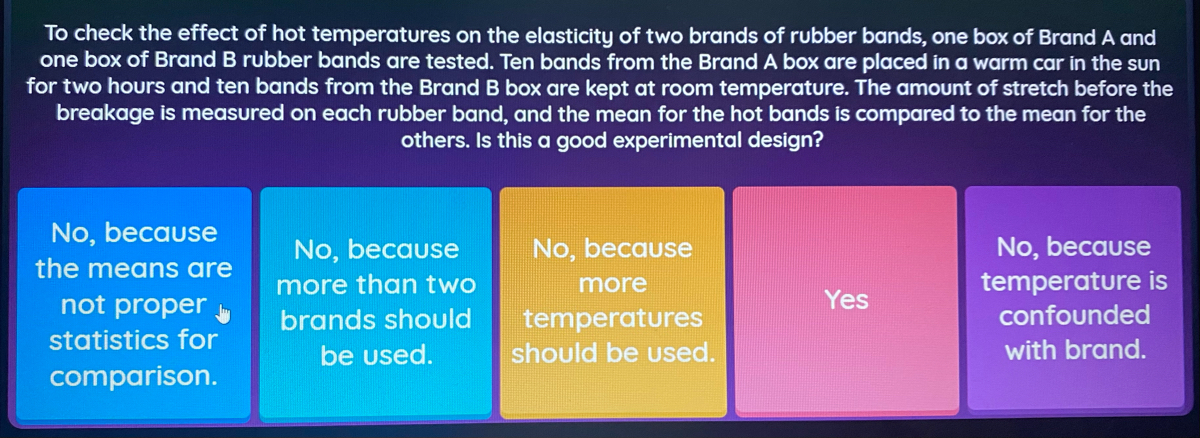

Transcribed Image Text:To check the effect of hot temperatures on the elasticity of two brands of rubber bands, one box of Brand A and
one box of Brand B rubber bands are tested. Ten bands from the Brand A box are placed in a warm car in the sun
for two hours and ten bands from the Brand B box are kept at room temperature. The amount of stretch before the
breakage is measured on each rubber band, and the mean for the hot bands is compared to the mean for the
others. Is this a good experimental design?
No, because
No, because
temperature is
confounded
No, because
No, because
the means are
more than two
more
not proper
Yes
brands should
temperatures
should be used.
statistics for
be used.
with brand.
comparison.
Expert Solution
This question has been solved!
Explore an expertly crafted, step-by-step solution for a thorough understanding of key concepts.

This is a popular solution

Trending nowThis is a popular solution!

Step by stepSolved in 2 steps

Knowledge Booster


Learn more about
Need a deep-dive on the concept behind this application? Look no further. Learn more about this topic, statistics and related others by exploring similar questions and additional content below.Similar questions
- The toco toucan, the largest member of the toucan family, possesses the largest beak relative to body size of all birds. This exaggerated feature has received various interpretations, such as being a refined adaptation for feeding. However, the large surface area may also be an important mechanism for radiating heat (and hence cooling the bird) as outdoor temperature increases. Here are data for beak heat loss, as a percent of total body heat loss from all sources, at various temperatures in degrees Celsius. [Note: The numerical values in this problem have been modified for testing purposes.] Temperature (oC)(oC) 15 16 17 18 19 20 21 22 23 24 25 26 27 28 29 30 Percent heat loss from beak 33 33 34 31 37 46 54 49 41 50 44 56 55 61 64 59 The equation of the least-squares regression line for predicting beak heat loss, as a percent of total body heat loss from all sources, from temperature is: (Use decimal notation. Enter the values of the intercept and slope rounded to two decimal…arrow_forwardOne company's bottles of grapefruit juice are filled by a machine that is set to dispense an average of 180 milliliters (ml) of liquid. A quality-control inspector must check that the machine is working properly. The inspector takes a random sample of 40 bottles and measures the volume of liquid in each bottle. We want to test Hg: μ = 180 Ha: 180 where μ = the true mean volume of liquid dispensed by the machine. The mean amount of liquid in the bottles is 179.6 ml and the standard deviation is 1.3 ml. A significance test yields a P-value of 0.0589. Interpret the P-value. Assuming the true mean volume of liquid dispensed by the machine is 180 ml, there is a 0.0589 probability of getting a sample mean of 179.6 just by chance in a random sample of 40 bottles filled by the machine. Assuming the true mean volume of liquid dispensed by the machine is 180 ml, there is a 0.0589 probability of getting a sample mean at least as far from 180 as 179.6 (in either direction) just by chance in a…arrow_forwardA study sought to demonstrate that soy beans inoculated with nitrogen-fixing bacteria yield more. This assumption was based on the fact that plants need nitrogen to manufacture vital proteins and amino acids and that nitrogen-fixing bacteria would make more of this substance available to plants, increasing their size and yield. The plant yield as measured by pod weight for each plant is given in the table. Determine if the mean pod weight exceeds the mean of uninoculated plants, 1.084 g. Alpha = 0.10 1.76 1.45 1.03 1.53 2.34 1.96 1.79 1.21arrow_forward
- Before every flight, the pilot must verify that the total weight of the load is less than the maximum allowable load for the aircraft. The Bombardier Dash 8 aircraft can carry 37 passengers, and a flight has fuel and baggage that allows for a total passenger load of 6200 lb. The pilot sees that the plane is full and all passengers are men. The aircraft will be overloaded if the mean weight of the passengers is greater than 6200lb/37 = 167.6lb. What is the probability that the aircraft is overloaded? Should the pilot take any action to correct for an overloaded aircraft? Assume that weights of men are normally distributed with a mean of 185.47 lb and a standard deviation of 39 lb. draw probability density functionarrow_forward"Durable press" cotton fabrics are treated to improve their recovery from wrinkles after washing. "Wrinkle recovery angle" measures how well a fabric recovers from wrinkles. Higher is better. Here are data on the wrinkle recovery angle (in degrees) for two types of treated fabrics: Permafresh 15 12 16 13 11 14 10 Hylite 16 20 18 15 19 A manufacturer wants to know how large is the difference in mean wrinkle recovery angle. Give a 90% confidence interval for the difference in mean wrinkle recovery angle: [three decimal accuracy] [three decimal accuracy]arrow_forwardThomas wants to compare the mean concentration of carbon monoxide (CO) on residential versus commercial streets, since these differ in terms of car traffic. In each of three neighborhoods of Montréal (named A, B, and C below), he randomly chooses four locations for each type of street, for a total of 24 observations (2 street types x 3 neighborhoods x 4 locations). At each location, he measures CO concentration in the air over a period of 10 hours (8:00 AM-6:00 PM), and obtains the following data (in ppm/h). Question: Test whether or not the difference between residential and commercial streets in mean atmospheric CO concentration is the same among the three neighborhoods, and whether or not CO concentration in the air is the same, on average, for the two types of streets. Note that Neighborhood is considered a random block factor in the ANOVA. Use significant level= 0.05.arrow_forward
- Two of the hottest smartphones on the market are the newly released iPhone6 and the Samsung Galaxy S6. CNet.com offers online reviews of all major cell phones, including battery life tests. In a review of the iPhone6, the talk-time battery life of 35 iPhones was measured. Similarly, the talk-time battery life of 30 Galaxy S6s was measured. Two outputs are given below. Which is appropriate for analyzing the data collected? Output 1 lhi Mean of iPhone6 Hz : Mean of Galaxy S6 Sam ple Diff. Output 2 HR = mean of the paired difference between iPhone6 and Galaxy S6 Difference Std. Err. Difference Sam ple Diff. Std. Err. H1 - Hz -0.71759861 0.189403 iPhone6 - Galaxy S6 -0.754246 0.192151 Possible p-values: 0.0001, 0.0002, 0.9999 Possible p-values: 0.0002, 0.0004, 0.9998 OOutput 1 Output 2 Using the StatCrunch output chosen above, determine if there is a difference in the mean battery life for the two phones. Use a significance level of 0.01 when conducting the test. • Select the appropriate…arrow_forwardThe following data are from an experiment on carnations. The explanatory variable is the amount of inorganic bromine (micrograms per milliliter) in a plot of standard size. The response variable is the average number of flowers per carnation plant for the 30 plants grown in the plot. Find the change in number of flowers per plant given an increase in 1 µg per mL of inorganic bromine. Amount of bromine Average no. of flowers Select one: O a. -0.216 O b. 0.216 O c. O d. -3.81 4.04 3 3.2 4 2.9 6 3.7 7 2.2 8 1.8 10 2.3 12 1.7 15 16 0.8 0.3arrow_forwardYou have been hired to measure the concentration of ammonia in water from wells at two districts on Long Island. After sampling 10 wells in one of the districts you find the values are, in mg/L: 6.4, 2.1, 1.4, 0.7, 6.8, 3.2, 2.7, 1.6, 4.9, 1.2. Your assistant plots the data from the second set of wells and the histogram of data from that sample looks pretty much the same as for your data set. Which statistical test do you anticipate that you will use? An one-sample t-test An unpaired, two-sample t-test A paired, two-sample t-test A one-way anova A Mann-Whitney U test Main Contentarrow_forward
- A research study examined the cholesterol levels in two groups (control vs. salmon consumption group) to see whether consuming more salmon in the diet would make a difference on cholesterol levels. The mean cholesterol level of the 60 people in the control group was 240 with a SD of 20. The mean cholesterol level of the 60 people in the salmon consumption group was 210 with a SD of 21. Calculate the z or t test statisticarrow_forwardThe integral part of performing arts is ‘Jumping’ that requires strong muscular strength and elasticity of dancers. At what height a dancer vertically jump is one of the measures of dancer’s leg power, and however, it also depends on the level of expertise and amount of training s/he received. A research study conducted among Malaysian undergraduate student martial arts athletes (29 male and 25 female) reports that male arts athletes jump twenty-six percentage higher than their female counterparts. Assume that 90% of male athletes exceed the jump height of female counterparts. You are going to randomly select four male arts athletes and test them whether their vertical jump height exceed (success) or not exceed (failure) twenty-six percentage of the vertical height jump of female martial arts athletes. Let x represents the number of four male athletes who exceed twenty-six percentage of the standard vertical height jump of female athletes. Explain why this variable is binomial random…arrow_forwardTotal plasma volume is important in determining the required plasma component in blood replacement therapy for a person undergoing surgery. Plasma volume is influenced by the overall health and physical activity of an individual. Suppose that a random sample of 44 male firefighters are tested and that they have a plasma volume sample mean of x = 37.5 ml/kg (milliliters plasma per kilogram body weight). Assume that o = 8.00 ml/kg for the distribution of blood plasma.arrow_forward
arrow_back_ios
SEE MORE QUESTIONS
arrow_forward_ios
Recommended textbooks for you
- MATLAB: An Introduction with ApplicationsStatisticsISBN:9781119256830Author:Amos GilatPublisher:John Wiley & Sons Inc
 Probability and Statistics for Engineering and th...StatisticsISBN:9781305251809Author:Jay L. DevorePublisher:Cengage Learning
 Statistics for The Behavioral Sciences (MindTap C...StatisticsISBN:9781305504912Author:Frederick J Gravetter, Larry B. WallnauPublisher:Cengage Learning
  Elementary Statistics: Picturing the World (7th E...StatisticsISBN:9780134683416Author:Ron Larson, Betsy FarberPublisher:PEARSON
 The Basic Practice of StatisticsStatisticsISBN:9781319042578Author:David S. Moore, William I. Notz, Michael A. FlignerPublisher:W. H. Freeman
 Introduction to the Practice of StatisticsStatisticsISBN:9781319013387Author:David S. Moore, George P. McCabe, Bruce A. CraigPublisher:W. H. Freeman
MATLAB: An Introduction with Applications
Statistics
ISBN:9781119256830
Author:Amos Gilat
Publisher:John Wiley & Sons Inc
Probability and Statistics for Engineering and th...
Statistics
ISBN:9781305251809
Author:Jay L. Devore
Publisher:Cengage Learning
Statistics for The Behavioral Sciences (MindTap C...
Statistics
ISBN:9781305504912
Author:Frederick J Gravetter, Larry B. Wallnau
Publisher:Cengage Learning
Elementary Statistics: Picturing the World (7th E...
Statistics
ISBN:9780134683416
Author:Ron Larson, Betsy Farber
Publisher:PEARSON
The Basic Practice of Statistics
Statistics
ISBN:9781319042578
Author:David S. Moore, William I. Notz, Michael A. Fligner
Publisher:W. H. Freeman
Introduction to the Practice of Statistics
Statistics
ISBN:9781319013387
Author:David S. Moore, George P. McCabe, Bruce A. Craig
Publisher:W. H. Freeman