
Essentials Of Investments
11th Edition
ISBN: 9781260013924
Author: Bodie, Zvi, Kane, Alex, MARCUS, Alan J.
Publisher: Mcgraw-hill Education,
expand_more
expand_more
format_list_bulleted
Related questions
Concept explainers
Question
thumb_up100%
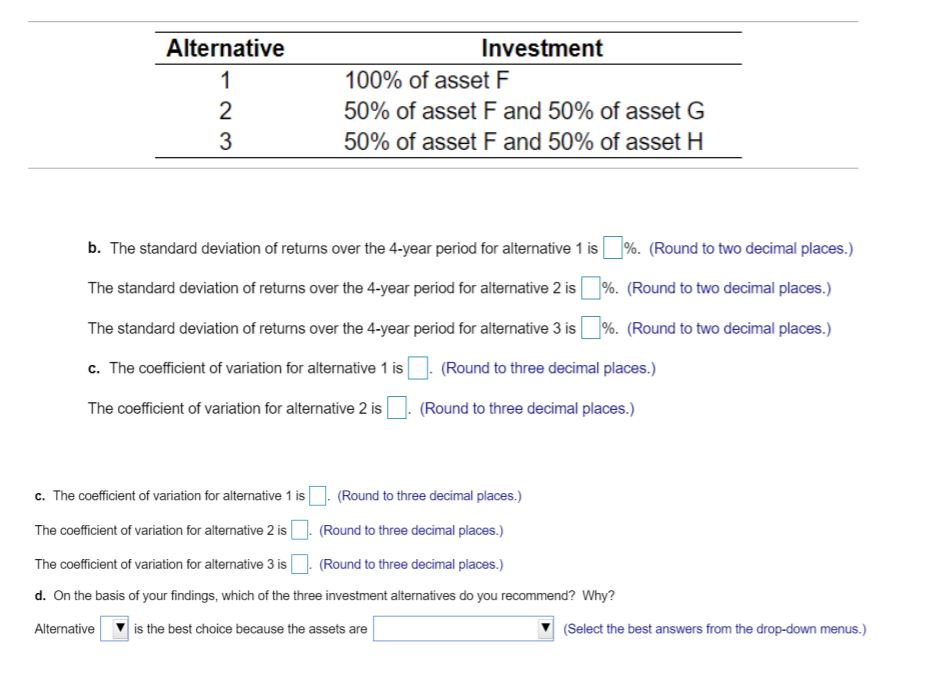

Transcribed Image Text:Alternative
Investment
100% of asset F
50% of asset F and 50% of asset G
3
50% of asset F and 50% of asset H
b. The standard deviation of returns over the 4-year period for alternative 1 is%. (Round to two decimal places.)
The standard deviation of returns over the 4-year period for alternative 2 is
%. (Round to two decimal places.)
The standard deviation of returns over the 4-year period for alternative 3 is%. (Round to two decimal places.)
c. The coefficient of variation for alternative 1 is
(Round to three decimal places.)
The coefficient of variation for alternative 2 i |
(Round to three decimal places.)
c. The coefficient of variation for alternative 1 is
(Round to three decimal places.)
The coefficient of variation for alternative 2 is
(Round to three decimal places.)
The coefficient of variation for alternative 3 is
(Round to three decimal places.)
d. On the basis of your findings, which of the three investment alternatives do you recommend? Why?
is the best choice because the assets are
(Select the best answers from the drop-down menus.)
Alternative

Transcribed Image Text:Portfolio analysis You have been given the expected return data shown in the first table on three assets - F, G, and H- over the period 2019-2022: .
Using these assets, you have isolated the three investment alternatives shown in the following table: .
a. Calculate the average return over the 4-year period for each of the three altenatives.
b. Calculate the standard deviation of returns over the 4-year period for each of the three alternatives.
c. Use your findings in parts a and b to calculate the coefficient of variation for each of the three alternatives.
d. On the basis of your findings, which of the three investment alternatives do you think performed better over this period? Why?
a. The expected return over the 4-year period for alternative 1 is %. (Round to two decimal place.)
The expected return over the 4-year period for alternative 2 is
%. (Round to two decimal place.)
The expected return over the 4-year period for alternative 3 is %. (Round to two decimal place.)
b. The standard deviation of returns over the 4-vear period for alternative 1 is
%. (Round to two decimal places.)
The standard deviation of returns over the 4-year period for alternative 2 is %. (Round to two decimal places.)
(Click on the icon here in order to copy the contents of the data table below
into a spreadsheet.)
Historical Return
Year
Asset F
Asset G
Asset H
2019
16%
17%
14%
2020
17%
16%
15%
2021
18%
15%
16%
2022
19%
14%
17%
Expert Solution
This question has been solved!
Explore an expertly crafted, step-by-step solution for a thorough understanding of key concepts.

This is a popular solution

Trending nowThis is a popular solution!

Step by stepSolved in 4 steps

Knowledge Booster


Learn more about
Need a deep-dive on the concept behind this application? Look no further. Learn more about this topic, finance and related others by exploring similar questions and additional content below.Similar questions
- You are evaluating five investment projects. You already calculated the rate of return for each alternative investment and incremental rate of return between the two alternatives as well. In calculating the incremental rate of return, a lower cost investment project is subtracted from the higher cost investment project. All rate of return figures are rounded to the nearest integers. Investment Alternative Initial Investment ($) Rate of Return (%) Rate of Return on Incremental Investment (%) A CDE A B C D E b.Select E. c. Select B. 35,000 45,000 d. Do nothing. 50,000 65,000 80,000 12 15 13 20 18 B 28 20 36 27 12 40 22 If all investment alternatives are mutually exclusive and the MARR is 12%, which alternative should be chosen? a. Select D. 42 25 -5arrow_forwardPossible outcomes for three investment alternatives and their probabilities of occurrence are given next. Failure Acceptable Successful Alternative 1 Alternative 2 Alternative 3 Outcomes Probability Outcomes Probability Outcomes Probability 50 0.40 70 0.20 85 0.40 0.20 130 0.40 325 0.40 0.40 265 0.40 410 0.20 Alternative 1 Alternative 2 Alternative 3 80 135 Using the coefficient of variation, rank the three alternatives in terms of risk from lowest to highest. Note: Do not round intermediate calculations. Round your answers to 3 decimal places. Coefficient of Variation Rankarrow_forwarduppose the average return on Asset A is 7.1 percent and the standard deviation is 8.3 percent, and the average return and standard deviation on Asset B are 4.2 percent and 3.6 percent, respectively. Further assume that the returns are normally distributed. Use the NORMDIST function in Excel® to answer the following questions. a. What is the probability that in any given year, the return on Asset A will be greater than 12 percent? Less than 0 percent? (Do not round intermediate calculations and enter your answers as a percent rounded to 2 decimal places, e.g., 32.16.) b. What is the probability that in any given year, the return on Asset B will be greater than 12 percent? Less than 0 percent? (Do not round intermediate calculations and enter your answers as a percent rounded to 2 decimal places, e.g., 32.16.) c-1. In a particular year, the return on Asset A was −4.38 percent. How likely is it that such a low return will recur at some point in the future? (Do not round…arrow_forward
- This is a three-part question. Answer to part one is 2.4%; please help me solve for parts two and three. Thank you.arrow_forwardNote:- Do not provide handwritten solution. Maintain accuracy and quality in your answer. Take care of plagiarism. Answer completely. You will get up vote for sure.arrow_forwardAn investment has been found to have two different IRRs, one at 14% and the other at 20%. When a required return of 17% is used, the NPV of the investment is negative. Knowing this: a. What range of required returns will generate a negative NPV? b. What range of required returns will generate a positive NPV?arrow_forward
- Which of the following statements are correct? I.The standard deviation is a measure of risk.II.The variance of yearly returns is roughly the variance of monthly returns multiplied with 12.III.To decide whether asset A is more risky than asset B we can either use their standard deviations or their variances. Group of answer choices II and III only I, II and III I and II only I and III onlyarrow_forwardCompute the (a) expected return, (b) standard deviation, and (c) coefficient of variation for investments with the following probability distributions: (LO 8-2) Probability rA rB 0.3 30.0% 5.0% 0.2 10.0 15.0 0.5 - 2.0 25.0arrow_forwardUse the data shown in the following table: K a. Compute the average return for each of the assets from 1929 to 1940 (the Great Depression). b. Compute the variance and standard deviation for each of the assets from 1929 to 1940. c. Which asset was the riskiest during the Great Depression? How does that fit with your intuition? Note: For all your answers type decimal equivalents. Data table Year 1929 1930 1931 1932 1933 1934 1935 1936 1937 1938 1939 1940 S&P 500 -0.08906 -0.25256 - 0.43861 -0.08854 0.52880 -0.02341 0.47221 0.32796 -0.35258 0.33204 -0.00914 - 0.10078 Small Stocks - 0.43081 -0.44698 -0.54676 -0.00471 2.16138 0.57195 0.69112 0.70023 - 0.56131 0.08928 0.04327 -0.28063 Corp. Bonds 0.04320 0.06343 -0.02380 0.12199 0.05255 0.09728 0.06860 0.06219 0.02546 0.04357 0.04247 0.04512 World Portfolio -0.07692 -0.22574 -0.39305 0.03030 0.66449 0.02552 0.22782 0.19283 -0.16950 0.05614 -0.01441 0.03528 Treasury Bills 0.04471 0.02266 0.01153 0.00882 0.00516 0.00265 0.00171 0.00173…arrow_forward
- I asked this question before, and got an answer, but I have a question about the response that was given. The original question was: For an initial investment of 100, an investment yields returns of X1 and X2, where X1 and X2 are independent normal random variables with mean 60 and variance 25. What is the probability that the rate of return of this investment is greater than 10%? In the answer that was given it says that the gain of the investment is X1+X2. My question is why can we just group those together as one amount? I was given a formula in my class that says the return on the investment would be the solution to the equation: -100+ X1/(1+r) + X2/(1+r)2=0. If this formula is used, a different solution would result for this problem.arrow_forwardThe historical returns for two investments-A and B-are summarized in the following table for the period 2016 to 2020, Use the data to answer the questions that follow. a. On the basis of a review of the return data, which investment appears to be more risky? Why? b. Calculate the standard deviation for each investment's returns. c. On the basis of your calculations in part b, which investment is more risky? Compare this conclusion to your observation in part a. a. On the basis of a review of the return data, which investment appears to be more risky? Why? (Choose the best answer below.) A. The riskier investment appears to be investment B, with returns that vary widely from the average relative to investment A, whose returns show less deviation from the average. B. Investment A and investment B have equal risk because the average returns are the same. C. The riskier investment appears to be investment A, with returns that vary widely from the average relative to investment B, whose…arrow_forwardThe historical returns for two investments A and B—are summarized in the following table for the period 2016 to 2020, Use the data to answer the questions that follow. a. On the basis of a review of the return data, which investment appears to be more risky? Why? b. Calculate the standard deviation for each investment's returns. c. On the basis of your calculations in part b, which investment is more risky? Compare this conclusion to your observation in part a. a. On the basis of a review of the return data, which investment appears to be more risky? Why? (Choose the best answer below.) A. The riskier investment appears to be investment B, with returns that vary widely from the average relative to investment A, whose returns show less deviation from the average. B. The riskier investment appears to be investment A, with returns that vary widely from the average relative to investment B, whose returns show less deviation from the average. C. Investment A and investment B have equal risk…arrow_forward
arrow_back_ios
SEE MORE QUESTIONS
arrow_forward_ios
Recommended textbooks for you
- Essentials Of InvestmentsFinanceISBN:9781260013924Author:Bodie, Zvi, Kane, Alex, MARCUS, Alan J.Publisher:Mcgraw-hill Education,


 Foundations Of FinanceFinanceISBN:9780134897264Author:KEOWN, Arthur J., Martin, John D., PETTY, J. WilliamPublisher:Pearson,
 Fundamentals of Financial Management (MindTap Cou...FinanceISBN:9781337395250Author:Eugene F. Brigham, Joel F. HoustonPublisher:Cengage Learning
 Corporate Finance (The Mcgraw-hill/Irwin Series i...FinanceISBN:9780077861759Author:Stephen A. Ross Franco Modigliani Professor of Financial Economics Professor, Randolph W Westerfield Robert R. Dockson Deans Chair in Bus. Admin., Jeffrey Jaffe, Bradford D Jordan ProfessorPublisher:McGraw-Hill Education
Essentials Of Investments
Finance
ISBN:9781260013924
Author:Bodie, Zvi, Kane, Alex, MARCUS, Alan J.
Publisher:Mcgraw-hill Education,
Foundations Of Finance
Finance
ISBN:9780134897264
Author:KEOWN, Arthur J., Martin, John D., PETTY, J. William
Publisher:Pearson,
Fundamentals of Financial Management (MindTap Cou...
Finance
ISBN:9781337395250
Author:Eugene F. Brigham, Joel F. Houston
Publisher:Cengage Learning
Corporate Finance (The Mcgraw-hill/Irwin Series i...
Finance
ISBN:9780077861759
Author:Stephen A. Ross Franco Modigliani Professor of Financial Economics Professor, Randolph W Westerfield Robert R. Dockson Deans Chair in Bus. Admin., Jeffrey Jaffe, Bradford D Jordan Professor
Publisher:McGraw-Hill Education