
Essentials Of Investments
11th Edition
ISBN: 9781260013924
Author: Bodie, Zvi, Kane, Alex, MARCUS, Alan J.
Publisher: Mcgraw-hill Education,
expand_more
expand_more
format_list_bulleted
Related questions
Concept explainers
Question
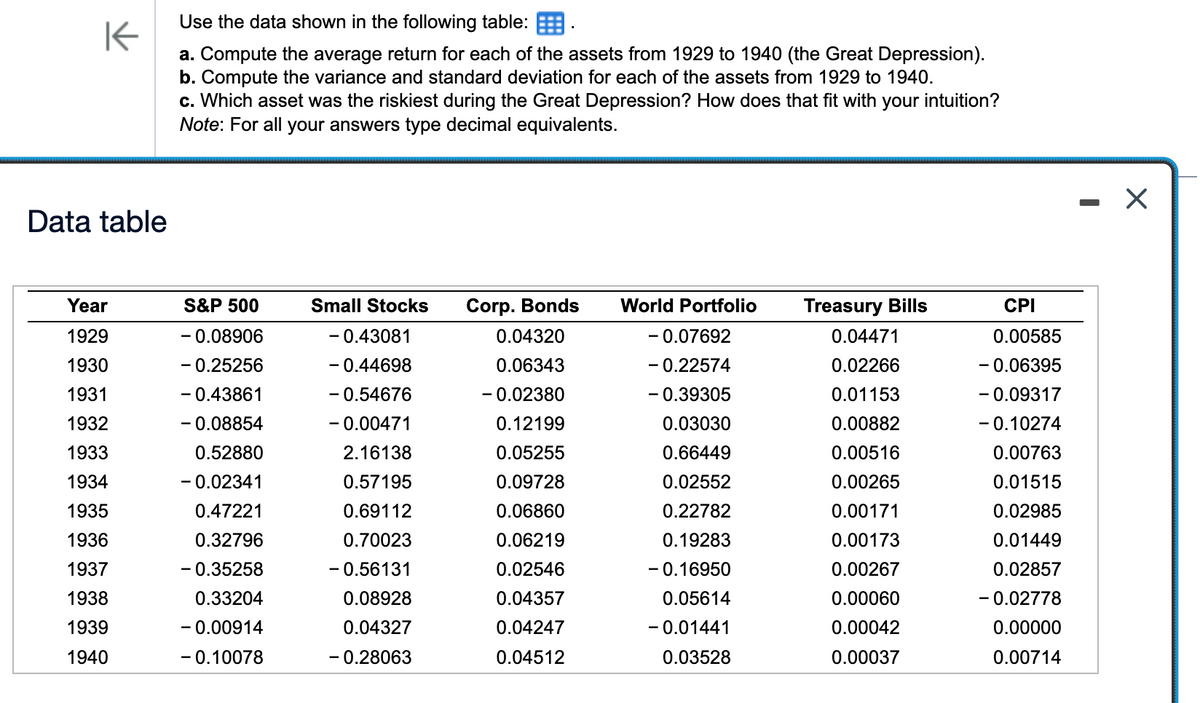

Transcribed Image Text:Use the data shown in the following table:
K
a. Compute the average return for each of the assets from 1929 to 1940 (the Great Depression).
b. Compute the variance and standard deviation for each of the assets from 1929 to 1940.
c. Which asset was the riskiest during the Great Depression? How does that fit with your intuition?
Note: For all your answers type decimal equivalents.
Data table
Year
1929
1930
1931
1932
1933
1934
1935
1936
1937
1938
1939
1940
S&P 500
-0.08906
-0.25256
- 0.43861
-0.08854
0.52880
-0.02341
0.47221
0.32796
-0.35258
0.33204
-0.00914
- 0.10078
Small Stocks
- 0.43081
-0.44698
-0.54676
-0.00471
2.16138
0.57195
0.69112
0.70023
- 0.56131
0.08928
0.04327
-0.28063
Corp. Bonds
0.04320
0.06343
-0.02380
0.12199
0.05255
0.09728
0.06860
0.06219
0.02546
0.04357
0.04247
0.04512
World Portfolio
-0.07692
-0.22574
-0.39305
0.03030
0.66449
0.02552
0.22782
0.19283
-0.16950
0.05614
-0.01441
0.03528
Treasury Bills
0.04471
0.02266
0.01153
0.00882
0.00516
0.00265
0.00171
0.00173
0.00267
0.00060
0.00042
0.00037
CPI
0.00585
- 0.06395
- 0.09317
-0.10274
0.00763
0.01515
0.02985
0.01449
0.02857
-0.02778
0.00000
0.00714
X
Expert Solution
This question has been solved!
Explore an expertly crafted, step-by-step solution for a thorough understanding of key concepts.

This is a popular solution
Step 1: Compute the average return for each of the assets from 1929 to 1940
VIEW Step 2: b. Compute the variance and standard deviation for each of the assets from 1929 to 1940.
VIEW Step 3: c. Which asset was the riskiest during the Great Depression? How does that fit with your intuition?
VIEW Solution
VIEW 
Trending nowThis is a popular solution!

Step by stepSolved in 4 steps

Knowledge Booster


Learn more about
Need a deep-dive on the concept behind this application? Look no further. Learn more about this topic, finance and related others by exploring similar questions and additional content below.Similar questions
- Total risk is measured by _____ and systematic risk is measured by _____. Group of answer choices Standard deviation; variance. Standard deviation; beta. Beta; standard deviation. Alpha; beta. Beta; alpha.arrow_forwardSuppose the gain from an investment is a normal random variable with mean 2 and standard deviation1.25. Compute the VaR for this investment.arrow_forwardWhat type of question is finding the detail to more clearly understand why net income is decreasing when revenues are increasing? Multiple Choice What happened? What is happening? Why did it happen? What are the root causes of past results? Will it happen in the future? What is the probability something will happen? Is it forecastable? What should we do based on what we expect will happen? What should we do based on what we expect will happen? How do we optimize our performance based on potential constraints?arrow_forward
- Over the past 3 years an investment returned 0.16, -0.11, and 0.08. What is the variance of returns?arrow_forwardHow do you turn an income statement int a forecasted return? And how is it helpful?arrow_forwardMatt Peters wishes to evaluate the risk and return behaviors associated with various combinations of assets V and W under three assumed degrees of correlation: perfectly positive, uncorrelated, and perfectly negative. The expected return and standard deviations calculated for each of the assets are shown in the following table: Asset Expected return, r Standard deviation), σ V 9% 14 W 11% 20% If the returns of assets V and W are perfectly positively correlated (correlation coefficient=+1), describe the range of (1) expected return and (2) standard deviation associated with all possible portfolio combinations. b. If the returns of assets V and W are uncorrelated (correlation coefficient=0),describe the approximate range of (1) expected return and (2) standard deviation associated with all possible portfolio combinations. c. If the returns of assets V and W are perfectly negatively correlated (correlation coefficient=−1),…arrow_forward
- Required information Consider the following factors. 1. (FIP,21%,34) 2. (A/G,21%,45) Find the numerical values of the factors using the appropriate formula. The numerical value of factor 1 is The numerical value of factor 2 isarrow_forwardWhich of the following are measurements of risk? range coefficient of variation mean average standard deviation medianarrow_forwardWhich of the following statements about the mean-variance criterion is correct? The mean return equals the riskless interest. Investors select assets that provide the highest variance for the same or higher expected return. Investors select assets that provide the highest rate of return. Investors select assets that provide the lowest variance for the same or higher expected return.arrow_forward
- 1. What percent of the area under the standard normal curve is within one standard deviation of (above or below) the mean? 2. What does this tell you about scores that are more than one standard deviation away from the mean?arrow_forwardGiven the data here, Compute the average return for each of the assets from 1929 to 1940 (the Great Depression) (Round to five decimalplaces.) Compute the variance and standard deviation for each of the assets from 1929 to 1940. (Round to five decimalplaces.) Which asset was riskiest during the Great Depression? How does that fit with your intuition? (Round to five decimalplaces.) Note: Notice that the answers for average return, variance and standard deviation must be entered in decimal format.arrow_forwardTime series forecasting maybe used to predict future values of a variable by: A. A simple moving average B. A weighted moving average C. Exponential smoothing D. All of the abovearrow_forward
arrow_back_ios
SEE MORE QUESTIONS
arrow_forward_ios
Recommended textbooks for you
- Essentials Of InvestmentsFinanceISBN:9781260013924Author:Bodie, Zvi, Kane, Alex, MARCUS, Alan J.Publisher:Mcgraw-hill Education,


 Foundations Of FinanceFinanceISBN:9780134897264Author:KEOWN, Arthur J., Martin, John D., PETTY, J. WilliamPublisher:Pearson,
 Fundamentals of Financial Management (MindTap Cou...FinanceISBN:9781337395250Author:Eugene F. Brigham, Joel F. HoustonPublisher:Cengage Learning
 Corporate Finance (The Mcgraw-hill/Irwin Series i...FinanceISBN:9780077861759Author:Stephen A. Ross Franco Modigliani Professor of Financial Economics Professor, Randolph W Westerfield Robert R. Dockson Deans Chair in Bus. Admin., Jeffrey Jaffe, Bradford D Jordan ProfessorPublisher:McGraw-Hill Education
Essentials Of Investments
Finance
ISBN:9781260013924
Author:Bodie, Zvi, Kane, Alex, MARCUS, Alan J.
Publisher:Mcgraw-hill Education,
Foundations Of Finance
Finance
ISBN:9780134897264
Author:KEOWN, Arthur J., Martin, John D., PETTY, J. William
Publisher:Pearson,
Fundamentals of Financial Management (MindTap Cou...
Finance
ISBN:9781337395250
Author:Eugene F. Brigham, Joel F. Houston
Publisher:Cengage Learning
Corporate Finance (The Mcgraw-hill/Irwin Series i...
Finance
ISBN:9780077861759
Author:Stephen A. Ross Franco Modigliani Professor of Financial Economics Professor, Randolph W Westerfield Robert R. Dockson Deans Chair in Bus. Admin., Jeffrey Jaffe, Bradford D Jordan Professor
Publisher:McGraw-Hill Education