MATLAB: An Introduction with Applications
6th Edition
ISBN: 9781119256830
Author: Amos Gilat
Publisher: John Wiley & Sons Inc
expand_more
expand_more
format_list_bulleted
Question
A collection of observation produced by sorting them into classes and showing their frequency of occurrence in each class.
frequency
cumulative frequency
frequency distribution
class boundary
Are used to separate the classes so that there are no gaps in the frequency distribution.
lower limi
upper limit
class interval
class boundaries

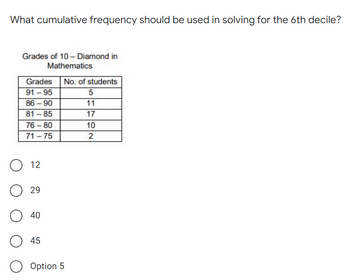
Transcribed Image Text:What cumulative frequency should be used in solving for the 6th decile?
Grades of 10 - Diamond in
Mathematics
Grades No. of students
91-95
5
86-90
11
81-85
17
76-80
10
71-75
2
12
29
40
O45
O Option 5
Expert Solution
This question has been solved!
Explore an expertly crafted, step-by-step solution for a thorough understanding of key concepts.
This is a popular solution
Trending nowThis is a popular solution!
Step by stepSolved in 2 steps

Knowledge Booster
Similar questions
- Here is a data set: Construct a grouped frequency distribution table (GFDT) for this data set. You want 10 classes with a "nice" class width. Your classes should be labeled using interval notation. Each class contains its lower class limit, and the lower class limits should all be multiples of the class width. In that the data appears to be discrete, use a closed-interval to label each class. Data range [378,402] 403,427] 428,452] 453,477] [478,502] [503,527] [528,552] [553,577] [578,602] [603,627] X X 2 X 5 X Frequency 1 X 1 X X 3 7 X X 2 6 X X 0 549 406 487 518 445 620 378 468 558 525 499 521 444 479 537 486 491 411 545 549 529 489 484 448 448 556 532 431 Xarrow_forwardHere is a data set: Construct a grouped frequency distribution table (GFDT) for this data set. You want 10 classes with a "nice" class width. Your classes should be labeled using interval notation. Each class should contain its lower class limit and each sequential lower class limit should increase by increments of the class width. In that the data appears to be discrete, use a closed-interval to label each class. Data range Frequency 3 0 2 8 2 66 61 50.8 45.2 53.9 56.7 55.6 57.4 68 62.8 46.8 56.3 67.1 57.3 53.9 69.7 60.2 65.3 58.2 56.3 52.5 59.3 45.2 65.6 55.1 60.6 56.5 51.1 3 2 < ४ 8 ४ 8 q ४arrow_forwardQ2: Show work by typing please TYPINGarrow_forward
- Ages Number of students 15-18 10 19-22 7 23-26 9 27-30 9 31-34 10 35-38 2 Based on the frequency distribution above, find the relative frequency for the class with lower class limit 31Relative Frequency =arrow_forward4arrow_forwardThe accompanying table shows the tax, in dollars, on a pack of cigarettes in 30 randomly selected cities. Complete parts (a) through (g) below. Click the icon to view the table of data. (a) Construct a frequency distribution. Use a first class having a lower class limit of 0 and a class width of 0.50. (Type integers or decimals. Do not round.) Tax Frequency (b) Construct a relative frequency distribution Use a first class having a lower class limit of 0 and a class width of 0.50 (Round to two decimal places as needed.) Tax Relative Frequency (c) Construct a frequency histogram. Choose the correct graph below. OA. Taxes on a pack of cigarettes (in dollars) -X 2.87 0.58 1.16 1.07 2.16 0.41 0.84 2.59 0.28 0.35 0.78 0.86 1089 427 225 1.52 3.41 0.89 4.27 2.25 2.23 1.64 1.54 1.46 1.68 1.26 0.65 0.17 1.45 3.06 0.71 0.58 0.92 Print Done mit testarrow_forward
arrow_back_ios
arrow_forward_ios
Recommended textbooks for you
 MATLAB: An Introduction with ApplicationsStatisticsISBN:9781119256830Author:Amos GilatPublisher:John Wiley & Sons Inc
 Probability and Statistics for Engineering and th...StatisticsISBN:9781305251809Author:Jay L. DevorePublisher:Cengage Learning
 Statistics for The Behavioral Sciences (MindTap C...StatisticsISBN:9781305504912Author:Frederick J Gravetter, Larry B. WallnauPublisher:Cengage Learning
 Elementary Statistics: Picturing the World (7th E...StatisticsISBN:9780134683416Author:Ron Larson, Betsy FarberPublisher:PEARSON
 The Basic Practice of StatisticsStatisticsISBN:9781319042578Author:David S. Moore, William I. Notz, Michael A. FlignerPublisher:W. H. Freeman
 Introduction to the Practice of StatisticsStatisticsISBN:9781319013387Author:David S. Moore, George P. McCabe, Bruce A. CraigPublisher:W. H. Freeman

MATLAB: An Introduction with Applications
Statistics
ISBN:9781119256830
Author:Amos Gilat
Publisher:John Wiley & Sons Inc

Probability and Statistics for Engineering and th...
Statistics
ISBN:9781305251809
Author:Jay L. Devore
Publisher:Cengage Learning

Statistics for The Behavioral Sciences (MindTap C...
Statistics
ISBN:9781305504912
Author:Frederick J Gravetter, Larry B. Wallnau
Publisher:Cengage Learning

Elementary Statistics: Picturing the World (7th E...
Statistics
ISBN:9780134683416
Author:Ron Larson, Betsy Farber
Publisher:PEARSON

The Basic Practice of Statistics
Statistics
ISBN:9781319042578
Author:David S. Moore, William I. Notz, Michael A. Fligner
Publisher:W. H. Freeman

Introduction to the Practice of Statistics
Statistics
ISBN:9781319013387
Author:David S. Moore, George P. McCabe, Bruce A. Craig
Publisher:W. H. Freeman