
MATLAB: An Introduction with Applications
6th Edition
ISBN: 9781119256830
Author: Amos Gilat
Publisher: John Wiley & Sons Inc
expand_more
expand_more
format_list_bulleted
Related questions
Question
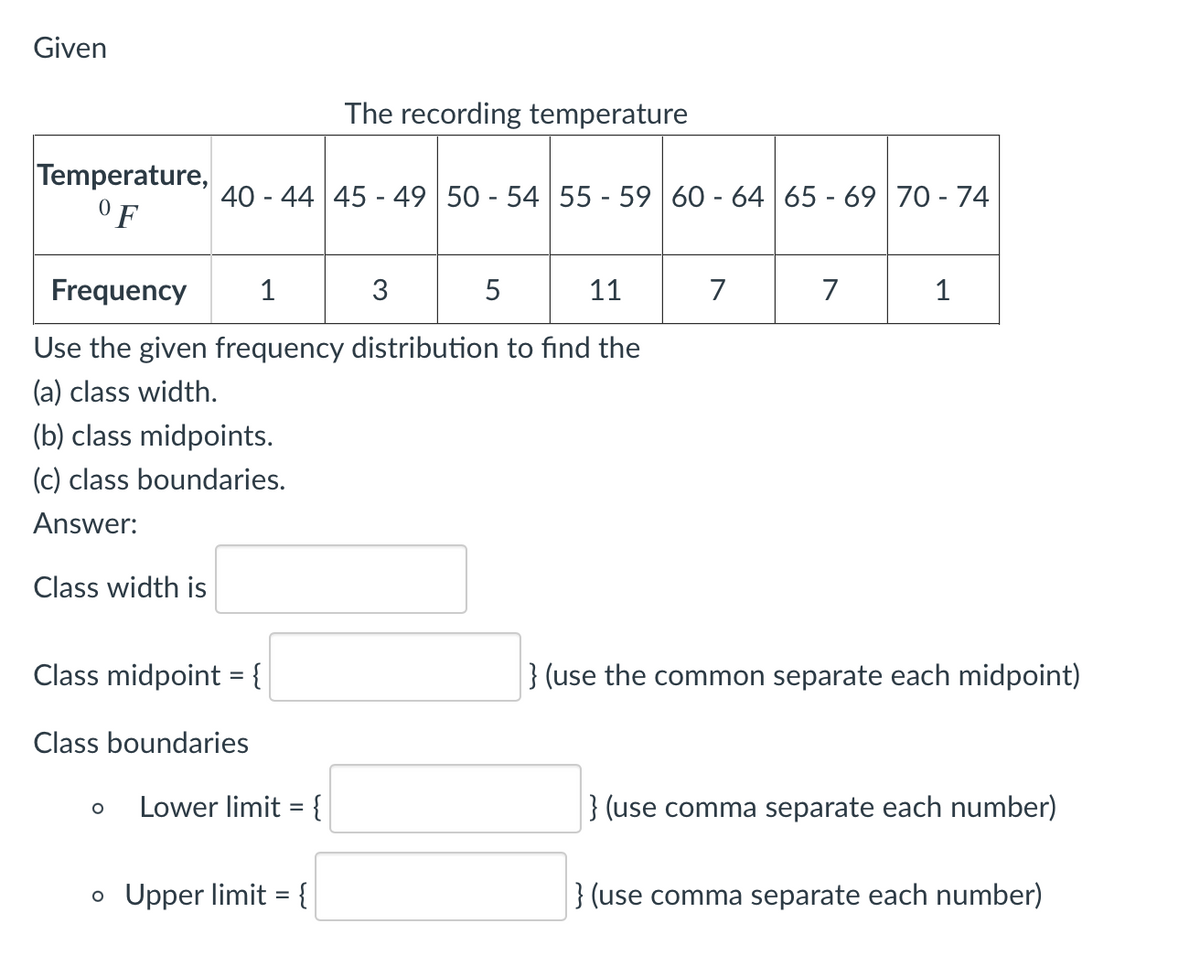

Transcribed Image Text:Given
The recording temperature
Temperature,
°F
40 - 44 45 - 49 50 - 54 55 - 59 60 - 64 65 - 69 70 - 74
Frequency
1
3
5
11
7
7
1
Use the given frequency distribution to find the
(a) class width.
(b) class midpoints.
(c) class boundaries.
Answer:
Class width is
Class midpoint = {
} (use the common separate each midpoint)
%3D
Class boundaries
Lower limit = {
} (use comma separate each number)
o Upper limit = {
} (use comma separate each number)
Expert Solution
This question has been solved!
Explore an expertly crafted, step-by-step solution for a thorough understanding of key concepts.

This is a popular solution

Trending nowThis is a popular solution!

Step by stepSolved in 3 steps with 2 images

Knowledge Booster

Similar questions
- (a)How many values are in the class 29.5 - 34.5? (b)How many values fall between 24.5 and 44.5? (c)How many values are below 39.5? (d)How many values are above 34.5? **Please see attached photos of 2 graphsarrow_forwardUse the given frequency distribution to find the (a) class width. (b) class midpoints. (c) class boundaries. Temperature (°F) Frequency 50-52 1 53-55 3 56-58 5 59-61 11 62-64 7 65-67 7 68-70 1 (a) What is the class width?arrow_forwardRecall that a relative frequency histogram is used to graph quantitative data. Classes are chosen to divide the range of values into equal-length subintervals, then plotted along the horizontal axis. A bar is drawn for each class with height equal to the relative frequency for that class. To create a relative frequency histogram, first summarize the following data in a frequency table. 1 N 2 3 4 5 6 7 Class Class Boundaries 8 9 1.3 10 11 14.7 9.0 16.7 4.1 14.9 4.4 2.7 32.3 10.9 9.0 9.0 1.6 18.4 1.0 2.4 2.4 18.0 Since the measurements are all between the values 0 and 33, it will be convenient to choose 11 class intervals of length 3. Using the given data, tally the values within each class interval to determine the frequency of each class, and fill in the following table. 0 to <3 3.5 11.2 18.0 26.7 3.7 3 to 6 6 to 9 9 to 12 12 to < 15 15 to 18 18 to 21 21 to 24 24 to 27 0.2 6.1 13.5 27 to < 30 30 to 33 7.4 8.2 19.2 1 1 2 1 Frequency 10 5 1 4 1 X X 9.4 X 8.7 X 2.0 6.6 3.9 5.9 4.3 3.3 0.2…arrow_forward
- The data to the right represent the top speed (in kilometers per hour) of all the players (excepet goaltendeders) in a soccer league. Find (a) the number of classes (b) the class limits for the fourth class, and (c) the class width. There are ____ classes The lower class limit for the fourth class is ______. The class width is _____ Speed Number of Players 10-13.9 5 14-17.9 6 18-21.9 18 22-25.9 72 26-29.9 268 30-33.9 233arrow_forwardTemperature (°F) 50-52 53-55 56-58 59-61 62-64 65-67 68-70 Frequency 1 3 5 11 7 7 1arrow_forwardThe relative frequency polygon is a graph obtained by plotting: Relative frequency against mid-point of class intervals Relative frequency against class intervals Relative frequency against upper limit of class intervals Relative frequency against lower limit of class intervalsarrow_forward
- Q2: Show work by typing please TYPINGarrow_forwardDefine the term Periodicity?arrow_forwardHere is a data set: Data range 210-229 230-249 250-269 270-289 290-309 214 217 219 223 228 238 241 245 247 253 253 254 X Construct a frequency distribution table for this data set. • Number of classes: 10 • Use a "nice" class width, such as a multiple of 5 or 10. • Label classes using interval notation. • For example, if the class is 70-79, label it as [70,79]. The lower class limit should be a multiple of the class width. • • For example, if the class width is 10, the lower class limit should be a number like 30 or 40 (depending on the data). X 5 263 265 286 291 X 4 50 11 250 X 2 256 X 8 10% Frequency 28 266 269 287 290 291 303 305 307 56 259 262 Xarrow_forward
- Use the given frequency distribution to find the (a) class width. (b) class midpoints. (c) class boundaries. Temperature (°F) 50-52 Frequency 53-55 3 56-58 59-61 11 62-64 65-67 68-70 (a) What is the class width? (Type an integer or a decimal.) (b) What are the class midpoints? Complete the table below. (Type integers or decimals.) Temperature (°F) Frequency Midpoint 50-52 53-55 56-58 59-61 11 62-64 7 65-67 Enter your answer in each of the answer boxes. 7:35 PM 22% 1/4/2021 P Type here to search o 耳 PrtSc Delete Ins F11 F12 F9 F10 F7 F8 F5 F6 Esc Backspace 771arrow_forwardPlease explain and answerarrow_forwardUse the given frequency distribution to find the (a) class width. (b) class midpoints. (c) class boundaries. (a) What is the class width? (Type an integer or a decimal.) Temperature (°F) 32-35 36-39 40-43 44-47 48-51 52-55 56-59 Frequency 3 5 11 7 7 Darrow_forward
arrow_back_ios
SEE MORE QUESTIONS
arrow_forward_ios
Recommended textbooks for you
- MATLAB: An Introduction with ApplicationsStatisticsISBN:9781119256830Author:Amos GilatPublisher:John Wiley & Sons Inc
 Probability and Statistics for Engineering and th...StatisticsISBN:9781305251809Author:Jay L. DevorePublisher:Cengage Learning
 Statistics for The Behavioral Sciences (MindTap C...StatisticsISBN:9781305504912Author:Frederick J Gravetter, Larry B. WallnauPublisher:Cengage Learning
  Elementary Statistics: Picturing the World (7th E...StatisticsISBN:9780134683416Author:Ron Larson, Betsy FarberPublisher:PEARSON
 The Basic Practice of StatisticsStatisticsISBN:9781319042578Author:David S. Moore, William I. Notz, Michael A. FlignerPublisher:W. H. Freeman
 Introduction to the Practice of StatisticsStatisticsISBN:9781319013387Author:David S. Moore, George P. McCabe, Bruce A. CraigPublisher:W. H. Freeman
MATLAB: An Introduction with Applications
Statistics
ISBN:9781119256830
Author:Amos Gilat
Publisher:John Wiley & Sons Inc
Probability and Statistics for Engineering and th...
Statistics
ISBN:9781305251809
Author:Jay L. Devore
Publisher:Cengage Learning
Statistics for The Behavioral Sciences (MindTap C...
Statistics
ISBN:9781305504912
Author:Frederick J Gravetter, Larry B. Wallnau
Publisher:Cengage Learning
Elementary Statistics: Picturing the World (7th E...
Statistics
ISBN:9780134683416
Author:Ron Larson, Betsy Farber
Publisher:PEARSON
The Basic Practice of Statistics
Statistics
ISBN:9781319042578
Author:David S. Moore, William I. Notz, Michael A. Fligner
Publisher:W. H. Freeman
Introduction to the Practice of Statistics
Statistics
ISBN:9781319013387
Author:David S. Moore, George P. McCabe, Bruce A. Craig
Publisher:W. H. Freeman