MATLAB: An Introduction with Applications
6th Edition
ISBN: 9781119256830
Author: Amos Gilat
Publisher: John Wiley & Sons Inc
expand_more
expand_more
format_list_bulleted
Concept explainers
Question

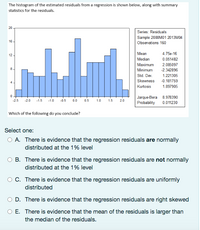
Transcribed Image Text:The histogram of the estimated residuals from a regression is shown below, along with summary
statistics for the residuals.
20
Series: Residuals
Sample 2000M01 2013М04
Observations 160
16 -
Mean
4.75e-16
12 -
Median
0.051482
Мaximum
2.085097
8.
Minimum
-2.342896
Std. Dev.
1.221305
Skewness
-0.181759
Kurtosis
1.897905
Jarque-Bera 8.978390
Probability 0.011230
-2.5
-2.0
-1.5
-1.0
-0.5
0.0
0.5
1.0
1.5
2.0
Which of the following do you conclude?
Select one:
O A. There is evidence that the regression residuals are normally
distributed at the 1% level
B. There is evidence that the regression residuals are not normally
distributed at the 1% level
C. There is evidence that the regression residuals are uniformly
distributed
D. There is evidence that the regression residuals are right skewed
O E. There is evidence that the mean of the residuals is larger than
the median of the residuals.
Expert Solution
This question has been solved!
Explore an expertly crafted, step-by-step solution for a thorough understanding of key concepts.
Step by stepSolved in 2 steps

Knowledge Booster
Learn more about
Need a deep-dive on the concept behind this application? Look no further. Learn more about this topic, statistics and related others by exploring similar questions and additional content below.Similar questions
- According to the figure, which one is false about a normally-distributed random variable with mean M and standard deviation S? Probability of Cases in portions of the curve Standard Deviations From The Mean Cumulative % The Normal Distribution 4 -40 Values -0.0013 -2.580 -30 0.1% -1.960 -0.0214 -20 2.3% 0.1359 -10 15.9% 95% of values 99% of values 0.3413 0 50% -0.3413 +10 84.1% 0.1359 1.960 +20 97.7% 2.580 → 0.0214 1 +30 99.9% -0.0013 +40 The probability of an observation at least one standard deviation more than M is almost 15.9%. The probability of an outcome at least three standard deviations away from M is less than 1%. Almost 95% of all observations are in the interval [M- 2.58 S, M + 2.58 S]. Almost 2.3\% of observations are less than M - 2S.arrow_forwardA sample of 3 measurements are taken and recorded: a =8, y = 10 and z = 7 The sample mean is: x = = 8.33 Fill in the table below. aj (a; - x)2 Ex: 5.34 Ex: 5.34 Ex: 5.34 82 = (z-z)*+(y-a)* +(z-z) Ex: 5.34 (z-2)*+(y-z)* +(z-) = Ex: 5.34arrow_forwardWhat type of distribution is appropriate to model the number of cars driving through a certain road between 2 and 3pm on a typical day Exponential Poisson Binomial Geometric Normalarrow_forward
- E Question Help Find the indicated IQ score. The graph to the right depicts IQ scores of adults, and those scores are normally distributed with a mean of 100 and a standard deviation of 15. Click to view page 1 of the table Click to view page 2 of the table, 0.97 The indicated IQ score, x, is (Round to one decimal place as needed.) Enter your answer in the answer box. Save for Later O vA 12:50 esc DII @ 23 %24 96 & back 3 4 6 8 y uarrow_forwardSAMPLE 1 MEAN 5.61 MEDIAN 5.6 MODE 5.6 STANDARD ERROR 0.39992384 STANDARD DEVIATION 2.1904731 SAMPLE VARIANCE 4.79817241 KUTOSIS -0.07445435 SKEWNESS -0.69709258 RANGE 7.9 MINIMUM 1.1 MAXIMUM 9 SAMPLE COUNT 30 SUM 168.3 SAMPLE 2 MEAN 7.326666667 MEDIAN 7.3 MODE 8.7 STANDARD ERROR 0.248717785 STANDARD DEVIATION 1.362283411 SAMPLE VARIANCE 1.855816092 KUTOSIS -0.118922156 SKEWNESS -0.015286932 RANGE 5.6 MINIMUM 4.6 MAXIMUM 10.2 SAMPLE COUNT 30 SUM 219.8 AND THIS IS MY t-TEST-ASSUMING EQUAL VARIANCE Variable 1 Variable 2 Mean 5.61 7.326666667 Variance 4.798172414 1.855816092 Observations 30 30 Pooled Variance 3.326994253 Hypothesized Mean Difference 0 df 58 t Stat -3.645067529 P(T<=t) one-tail 0.000286392 t Critical one-tail 1.671552762 P(T<=t) two-tail 0.000572783 t Critical two-tail 2.001717484 IS IT RIGHT THAT MY T-STAT CAME OUT AS A NEGATIVE, AND ARE MY CALCULATIONS…arrow_forwardCompute the critical value z/2 that corresponds to a 88% level of confidence. Click here to view the standard norma distribution table (page 1D Click here to view the standard normal distribution table (page 2). Za/2 = (Round to two decimal places as needed.)arrow_forward
arrow_back_ios
arrow_forward_ios
Recommended textbooks for you
 MATLAB: An Introduction with ApplicationsStatisticsISBN:9781119256830Author:Amos GilatPublisher:John Wiley & Sons Inc
 Probability and Statistics for Engineering and th...StatisticsISBN:9781305251809Author:Jay L. DevorePublisher:Cengage Learning
 Statistics for The Behavioral Sciences (MindTap C...StatisticsISBN:9781305504912Author:Frederick J Gravetter, Larry B. WallnauPublisher:Cengage Learning
 Elementary Statistics: Picturing the World (7th E...StatisticsISBN:9780134683416Author:Ron Larson, Betsy FarberPublisher:PEARSON
 The Basic Practice of StatisticsStatisticsISBN:9781319042578Author:David S. Moore, William I. Notz, Michael A. FlignerPublisher:W. H. Freeman
 Introduction to the Practice of StatisticsStatisticsISBN:9781319013387Author:David S. Moore, George P. McCabe, Bruce A. CraigPublisher:W. H. Freeman

MATLAB: An Introduction with Applications
Statistics
ISBN:9781119256830
Author:Amos Gilat
Publisher:John Wiley & Sons Inc

Probability and Statistics for Engineering and th...
Statistics
ISBN:9781305251809
Author:Jay L. Devore
Publisher:Cengage Learning

Statistics for The Behavioral Sciences (MindTap C...
Statistics
ISBN:9781305504912
Author:Frederick J Gravetter, Larry B. Wallnau
Publisher:Cengage Learning

Elementary Statistics: Picturing the World (7th E...
Statistics
ISBN:9780134683416
Author:Ron Larson, Betsy Farber
Publisher:PEARSON

The Basic Practice of Statistics
Statistics
ISBN:9781319042578
Author:David S. Moore, William I. Notz, Michael A. Fligner
Publisher:W. H. Freeman

Introduction to the Practice of Statistics
Statistics
ISBN:9781319013387
Author:David S. Moore, George P. McCabe, Bruce A. Craig
Publisher:W. H. Freeman