
MATLAB: An Introduction with Applications
6th Edition
ISBN: 9781119256830
Author: Amos Gilat
Publisher: John Wiley & Sons Inc
expand_more
expand_more
format_list_bulleted
Related questions
Question

Transcribed Image Text:nvestigate
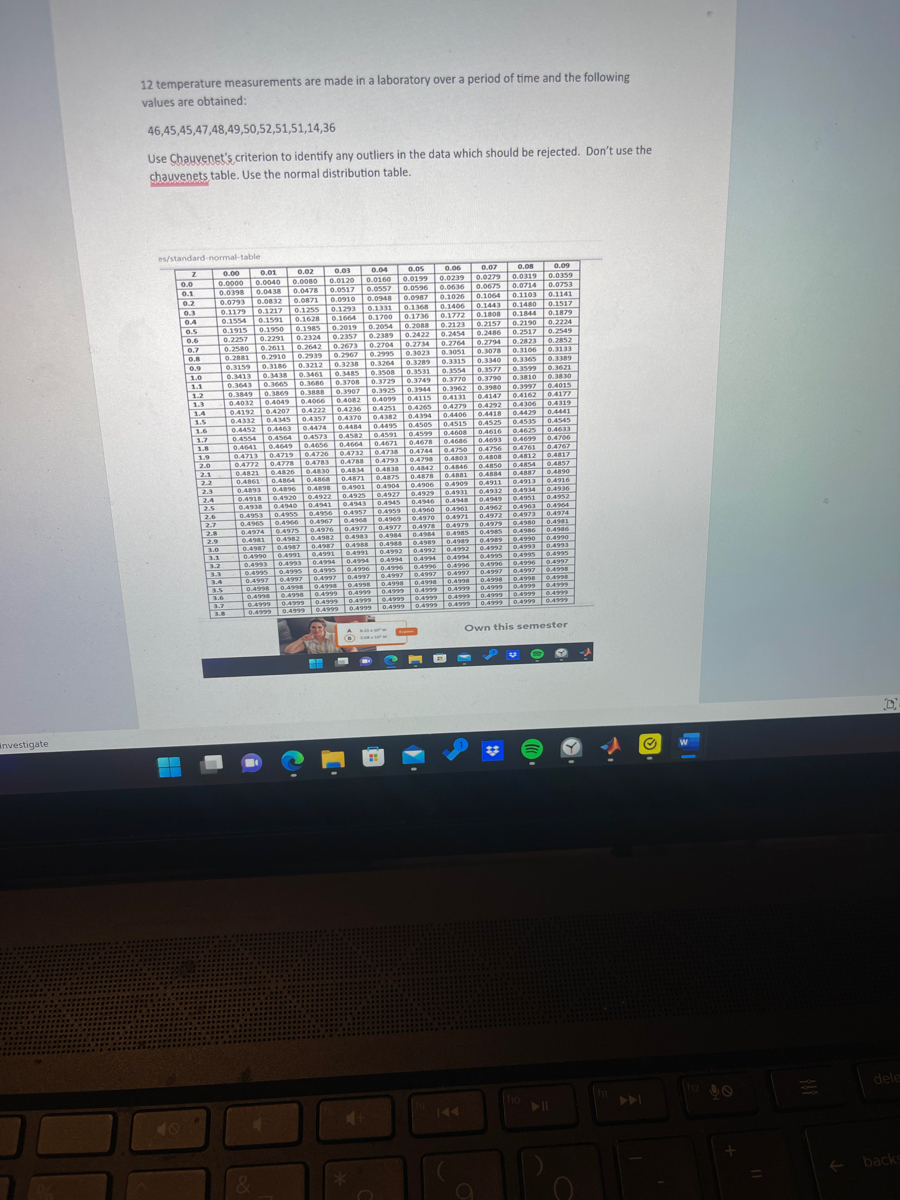
12 temperature measurements are made in a laboratory over a period of time and the following
values are obtained:
46,45,45,47,48,49,50,52,51,51,14,36
Use Chauvenet's criterion to identify any outliers in the data which should be rejected. Don't use the
chauvenets table. Use the normal distribution table.
es/standard-normal-table
0.06
0.07
0.08
Z 0.00 0.0180 0.0120 0.0160 0.0199 0.0239 0.0279 0.0319
0.0000 0.0040
0.0398 0.0438 0.0478 0.0517 0.0557 0.0596
0.0
0.1
0.2
0.3
0.4
0.5
0.6
0.7
0.8
0.9
=
1.0
1.1
1.2
1.3
1.4
1.5
1.6
1.7
1.8
20
1.9
2.0
2.1
2.2
2.3
74
2.4
2.5
2.6
24
2.7
2.8
2.9
3.0
3.1
=
Ee
0.04 0.05
0.02
02 0.03
0.1179 0.1217 0.1255 0.1293 0.1331 0.1368
0.1554 0.1591 0.1628 0.1664 0.1700 0.1736
3.5
3.6
3.7
3.8
0.0793 0.0832 0.0871 0.0910 0.0948 0.0987 0.1026 0.10 1480 0.1517
0.1879
0.1915 0.19502019 0.2054 0.2088 0.2123 0.2157 0.2190 0.2224
0.2422 0.2454 0.2486 0.2517 0.2549
0.1985
0.2324
0.2257 0.2293
0.2580 0.2611 0.2642
0.2389
Amor P7704 0.2764 0.2794 0.2823 0.2852
0.2673
0.2734
0.3051 0.3078 0.3106 0.3133
0.2881 0.2910 0.2939 0.2967 0.2995 0.3023
0.3159 0.3186 0.3212 0.3238 0.3264 0.3289 0.3315 0.3340 0.3365 0.3389
9 0.3621
0.3438 0.3461 0.3485 0.3508 0.3531 0.3554 0.3577 0.3599
0.3810 0.3830
0.313
0.3849 0.3869 0.3888 0.3907 0.3925 0.3944 0.3962 0.3980 0.3997 0.4015
0.4032 0.4049 0.4066 0.4082 0.4099 0.4115 0.4131 0.4147 0.4162 0.4177
0.4265 0.4279 0.4292 0.4306 0.4319
0.4192 0.4207 0.4222 0.4236 0.4251
0.4394 0.4406 0.4418 0.4429 0.4441
0.4332 0.4345 0.4357 0.4370 0.4382
0.4515 0.4525 0.4535 0.4545
0.4608
04452 0.4463 0.4474 0.4484 0.4495 0.4505 0.4616 0.4625 0.4633
9.4554 0.4564 0.4573 0.4582 04591 0.4593.4093 0.4699 0.4706
0.4641 0.4649 0.4656 0.4664 0.4671 0.4678 0.4056 0.4756 0.4761 0.4767
0.4713 0.4719 04726 0.4732 0.4738 0.4744 0.4750 0.4756 0.4812 0.4817
0.4803 0.4808 0.4
0.4772 0.4778 0.4783 0.4788 0.4793 0.4798
0.4842 0.4846 0.4850 0.4854 0.4857
0.4821 0.4826 0.4830 0.4834 0.4838
0.4878
0.4881 0.4884 0.4887 0.4890
0.4861 0.4864 0.4868 0.4871 0.4875
0.4909 0.4911 0.4913 0.4916
0.4893 0.4896 0.4898 0.4901 0.4904 0.4906
0.4931 0.4932 0.4934 0.4936
0.4918 0.4920 0.4922 0.4925 0.4927 0.4929 0.4948 0.4949 0.4951 0.4952
0.4938 0.4940 0.4941 0.4943 0.4545 0.4940 0.4961 0.4962 0.4963 0.4964
0.4953 0.4955 0.4956 0.4957 0.4959 0.4960 0.4951 0.4972 0.4973 0.4974
0.4965 0.4966 0.4967 0.4968 0.4969 0.497004973 0.4379 0.4980 0.4981
0.4974 0.4975 0.4976 0.4977 0.497 0.4975 0.4985 0.4986 0.4986
0.4977
0.4961 0.4982 0.4982 0.4983 0.4984 0.4984 0.49850400 0.4990 0.4990
0.4987 0.4987 0.4967 0.4988 0.4988 0.4989 0.492 0.4992 0.4993 0.4993
0.4990 0.4991 0.4991 0.4991 0.4992 0.4992 0.4992 0.4995 0.4995 0.4995
0493 0.4993 0.4994 0.4994 0.4994 0.4994 0.499404990 0.4996 0.4997
0493 0.4995 0.4995 0.4996 0.4996 0.4996 0.499004997 0.4997 0.4998
04997 0.4997 0.4997 0.4997 0.4997 0.4997 0.4997 0.4998 0.4998 0.4998
0.4997
0492 0.4998 0.4998 0.4998 0.4998 0.4998 0.4998 0.4999 0.4999 0.4999
0.499804998 0.4999 0.4999 0.4999 0.4999 0.4999 0.4999 0.4999 0.4999
0.4999 0.4999 0.4999 0.4999 0.4999 0.49990
104999 104999 0.4999 0.4999
10.4922 0.4999 0.4999 0.4999 0.499
0.4999
4
&
BE
A O
Ⓒ 204-LPPM
*
0.0636 0.0675 0.0714
0.1103
fg
0.1406 0.1443
0.1772 0.1808 0.1844
144
Own this semester
a
0.09
0.0359
0.0753
0.1141
f10
@.
J
+
D
dele
backs
Expert Solution
This question has been solved!
Explore an expertly crafted, step-by-step solution for a thorough understanding of key concepts.

Step by stepSolved in 2 steps

Knowledge Booster

Similar questions
- In a distribution plot, if mean is much smaller than median, does the underlying sample have very large outliers, very small outliers or is the sample size is very small?arrow_forwardFind the proportion of Normally distributed observations with a z-score below 0.82. Give your answer to four decimal places. Find the proportion of Normally distributed observations with a z-score above -2.84. Give your answer to four decimal places. Find the proportion of N.d. observations with a z-score between z1= -2.58 and z2= 3.18. Give your answer to four decimal places.arrow_forwardPlease draw out answer and explain, thank you.arrow_forward
- 4.7, 5.0, 5.5, 4.2, 5.5, 5.9, 4.7, 5.4, 3.8 - samples of % peroxide in samples taken. determine the interquartile range, variance, and standard deviation of the percent peroxide data. use 2 decimal points for rounding and provide unitsarrow_forwardfor normal distribution mean is 50 liter per hour and standard deviation is 10 liter per hours . find the 68%,95%and 99.7% values by using emperical graph explain graph with all valuesarrow_forwardFind the proportion of Normally distributed observations with a z-score above 0.80. Give your answer to four decimal places. Find the proportion of N.d. observations with a z-score between z1= -0.34 and z2= 2.72. Give your answer to four decimal places.arrow_forward
- Assume the samples are random and independent, the populations are nomally distributed, and the population variances are equal. The table available below shows the prices (in dollars) for a sample of automobile batteries. The prices are classified according to battery type. At a = 0.10, is there enough evidence conclude that at least one mean battery price is different from the others? Complete parts (a) through (e) below. E Click the icon to view the battery cost data. (a) Let u1. P2. H3 represent the mean prices for the group size 35, 65, and 24/24F respectively. Identify the claim and state Ho and H. H Cost of batteries by type The claim is the V hypothesis. Group size 35 Group size 65 Group size 24/24F 101 111 121 124 D 146 173 182 278 124 140 141 89 (b) Find the critical value, Fo, and identify the rejection region. 90 79 84 The rejection region is F Fo, where Fo = (Round to two decimal places as needed.) (c) Find the test statistic F. Print Done F= (Round to two decimal places as…arrow_forwardAssume that IQ scores follow a Normal distribution with µ=100 and σ=16. Using our IQR rule for determining IQ score outliers, what IQ scores would establish the lower and upper fences for determining outliers?arrow_forwardDescribe the importnat features of the distribution by identifying the mode, overall shape, and outliers. a. Which measure of center (mean or median) and which measure of variability (Standard deviation or IQR) would be best to describe the distrubution and why?arrow_forward
arrow_back_ios
arrow_forward_ios
Recommended textbooks for you
- MATLAB: An Introduction with ApplicationsStatisticsISBN:9781119256830Author:Amos GilatPublisher:John Wiley & Sons Inc
 Probability and Statistics for Engineering and th...StatisticsISBN:9781305251809Author:Jay L. DevorePublisher:Cengage Learning
 Statistics for The Behavioral Sciences (MindTap C...StatisticsISBN:9781305504912Author:Frederick J Gravetter, Larry B. WallnauPublisher:Cengage Learning
  Elementary Statistics: Picturing the World (7th E...StatisticsISBN:9780134683416Author:Ron Larson, Betsy FarberPublisher:PEARSON
 The Basic Practice of StatisticsStatisticsISBN:9781319042578Author:David S. Moore, William I. Notz, Michael A. FlignerPublisher:W. H. Freeman
 Introduction to the Practice of StatisticsStatisticsISBN:9781319013387Author:David S. Moore, George P. McCabe, Bruce A. CraigPublisher:W. H. Freeman
MATLAB: An Introduction with Applications
Statistics
ISBN:9781119256830
Author:Amos Gilat
Publisher:John Wiley & Sons Inc
Probability and Statistics for Engineering and th...
Statistics
ISBN:9781305251809
Author:Jay L. Devore
Publisher:Cengage Learning
Statistics for The Behavioral Sciences (MindTap C...
Statistics
ISBN:9781305504912
Author:Frederick J Gravetter, Larry B. Wallnau
Publisher:Cengage Learning
Elementary Statistics: Picturing the World (7th E...
Statistics
ISBN:9780134683416
Author:Ron Larson, Betsy Farber
Publisher:PEARSON
The Basic Practice of Statistics
Statistics
ISBN:9781319042578
Author:David S. Moore, William I. Notz, Michael A. Fligner
Publisher:W. H. Freeman
Introduction to the Practice of Statistics
Statistics
ISBN:9781319013387
Author:David S. Moore, George P. McCabe, Bruce A. Craig
Publisher:W. H. Freeman