
MATLAB: An Introduction with Applications
6th Edition
ISBN: 9781119256830
Author: Amos Gilat
Publisher: John Wiley & Sons Inc
expand_more
expand_more
format_list_bulleted
Related questions
Question
Solve for B)
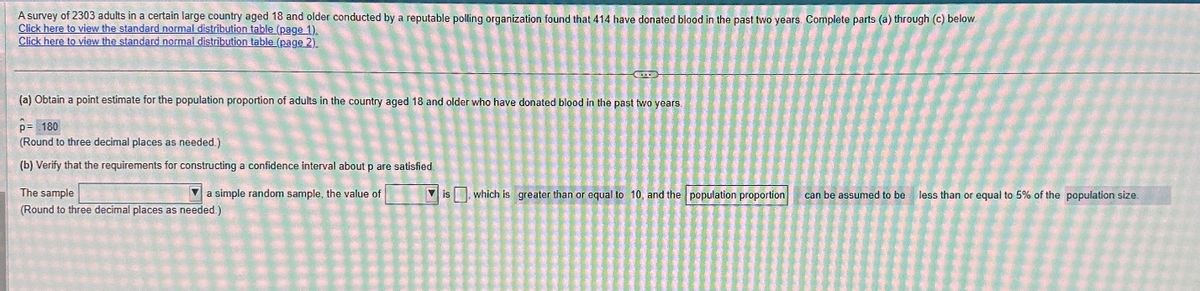

Transcribed Image Text:A survey of 2303 adults in a certain large country aged 18 and older conducted by a reputable polling organization found that 414 have donated blood in the past two years. Complete parts (a) through (c) below.
Click here to view the standard normal distribution table (page 1).
Click here to view the standard normal distribution table (page 2).
(a) Obtain a point estimate for the population proportion of adults in the country aged 18 and older who have donated blood in the past two years.
P = 180
(Round to three decimal places as needed.)
(b) Verify that the requirements for constructing a confidence interval about p are satisfied.
The sample
a simple random sample, the value of
(Round to three decimal places as needed.)
Vis which is greater than or equal to 10, and the population proportion
can be assumed to be less tha
or equal to 5%
the population size.

Transcribed Image Text:Standard Normal Distribution Table (page 1)
Area
-34
-3.3
-3.2
-2.1
-1.9
-1.8
0,00
0.0003
0.0005
0.0007
0.0010
0.0013
0.0019
0.0026
0.0035
0.0047
0.0062
0.0082
0.0107
0.0139
0.0179
0.0228
0.0287
0.0359
0.01
0.0003
0.0005
0.0007
0.0009
0.0013
0.0018
0.0025
0.0034
0.0045
0.0060
0.0080
0.0104
0.0136
0.0174
0.0222
0.0281
0.0351
0.02
0.0003
0.0005
0.0006
0.0009
0.0013
0.0018
0.0024
0.0033
0.0044
0.0059
0.0078
0.0102
0.0132
0.0170
0.0217
0.0274
0.0344
Standard Normal Distribution
0.03
0.04
0.05
0.0003
0.0004
0.0006
0.0000
0.0012
0.0017
0.0023
0.0032
0.0043
0.0057
0.0075
0.0099
0.0129
0.0166
0.0212
0.0268
0.0336
0.0003
0.0004
0.0006
0.0008
0.0012
0.0016
0.0023
0.0031
0.0041
0.0055
0.0073
0.0096
0.0125
0.0162
0.0207
0.0262
0.0329
0.0003
0.0004
0.0006
0.0008
0.0011
0.0040
0.0054
0.0071
0.0094
0.0122
0.0158
0.0202
0.06
0.0016
0.0015
0.0022 0.0021
0.0030
0.0029
0.0039
0.0052
0.0256
0.0322
0.0003
0.0004
0.0006
0.0008
0.0011
0.0069
0.0091
0.01 19
0.0154
0.0197
0.0250
0.0314
0.07
0.0003
0.0004
0.0005
0.0008
0.0011
0.0015
0.0021
0.0028
0.0038
0.0051
0.0068
0.0089
0.0116
0.0150
0.0192
0.0244
0.0307
0.08
0.0003
0.0004
0.0005
0.0007
0.0010
0.0014
0.0020
0.0027
0.0037
0.0049
0.0066
0.0087
0.0113
0.0146
0.0188
0.0239
0.0301
0.09
0.0002
0.0003
0.0005
0.0007
0.0010
0.0014
0.0019
0.0026
0.0036
0.0048
0.0064
0.0084
0.0110
0.0143
0.0183
0.0233
0.0294
n
I
Expert Solution
This question has been solved!
Explore an expertly crafted, step-by-step solution for a thorough understanding of key concepts.

Step by stepSolved in 3 steps with 3 images

Knowledge Booster

Similar questions
- Jordan and Amari run a 200-meter race, and Jordan wins by 13 meters. They decide to run the 200-meter race again with Jordan starting 13 meters behind the starting line. Find the correct answer to each of the following parts (a) through (d). O A. Jordan wins the second race because Jordan can run a longer distance in a longer amount time. O B. Amari wins the second race because Amari has a shorter distance to run. O C. Amari wins the second race because Jordan is not fast enough to be able to catch up in time. OD. Jordan wins the second race because Jordan can run a longer distance in a shorter amount of time. b. Suppose Jordan starts 8 meters behind the starting line in the second race. Who wins the race? O A. Amari wins the second race because Amari has a shorter distance to run. O B. Jordan wins the second race because Jordan can run faster than Amari. O C. Amari wins the second race because Jordan is not fast enough to be able to catch up in time. O D. Jordan wins the second race…arrow_forwardSolve for A,B,C,...,H in: (8*8j)=A+jB; (6j*9j)=C+jD; j9(8+2j)=E+jF; (8+4j)(9+4j)=G+jH.arrow_forward2. Find the difference quotient of Ax) = 4x² – 7x+5 %3Darrow_forward
- fx):xト4 figohlx= ニarrow_forwardSolve for X In(2xy. In) 2x+1 2メーSarrow_forwardOne year consumers spent an average of $22 on a meal at a resturant. Assume that the amount spent on a resturant meal is normally distributed and that the standard deviation is $3.Complete parts (a) through (c) below. a. What is the probability that a randomly selected person spent more than $24?arrow_forward
arrow_back_ios
arrow_forward_ios
Recommended textbooks for you
- MATLAB: An Introduction with ApplicationsStatisticsISBN:9781119256830Author:Amos GilatPublisher:John Wiley & Sons Inc
 Probability and Statistics for Engineering and th...StatisticsISBN:9781305251809Author:Jay L. DevorePublisher:Cengage Learning
 Statistics for The Behavioral Sciences (MindTap C...StatisticsISBN:9781305504912Author:Frederick J Gravetter, Larry B. WallnauPublisher:Cengage Learning
  Elementary Statistics: Picturing the World (7th E...StatisticsISBN:9780134683416Author:Ron Larson, Betsy FarberPublisher:PEARSON
 The Basic Practice of StatisticsStatisticsISBN:9781319042578Author:David S. Moore, William I. Notz, Michael A. FlignerPublisher:W. H. Freeman
 Introduction to the Practice of StatisticsStatisticsISBN:9781319013387Author:David S. Moore, George P. McCabe, Bruce A. CraigPublisher:W. H. Freeman
MATLAB: An Introduction with Applications
Statistics
ISBN:9781119256830
Author:Amos Gilat
Publisher:John Wiley & Sons Inc
Probability and Statistics for Engineering and th...
Statistics
ISBN:9781305251809
Author:Jay L. Devore
Publisher:Cengage Learning
Statistics for The Behavioral Sciences (MindTap C...
Statistics
ISBN:9781305504912
Author:Frederick J Gravetter, Larry B. Wallnau
Publisher:Cengage Learning
Elementary Statistics: Picturing the World (7th E...
Statistics
ISBN:9780134683416
Author:Ron Larson, Betsy Farber
Publisher:PEARSON
The Basic Practice of Statistics
Statistics
ISBN:9781319042578
Author:David S. Moore, William I. Notz, Michael A. Fligner
Publisher:W. H. Freeman
Introduction to the Practice of Statistics
Statistics
ISBN:9781319013387
Author:David S. Moore, George P. McCabe, Bruce A. Craig
Publisher:W. H. Freeman