
MATLAB: An Introduction with Applications
6th Edition
ISBN: 9781119256830
Author: Amos Gilat
Publisher: John Wiley & Sons Inc
expand_more
expand_more
format_list_bulleted
Related questions
Topic Video
Question
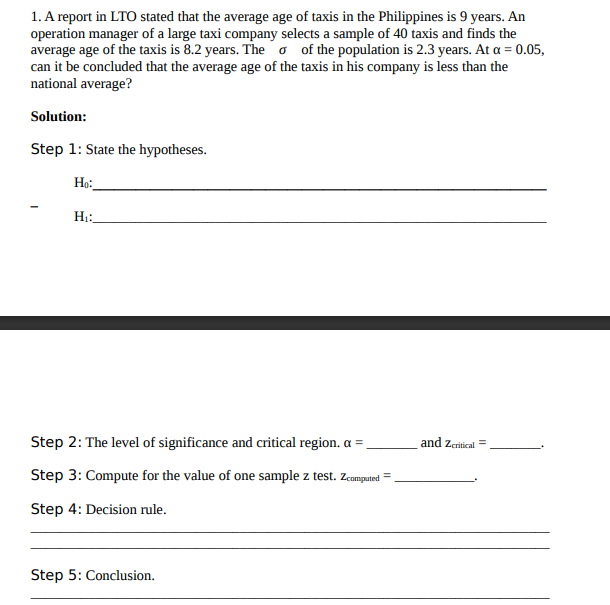

Transcribed Image Text:1. A report in LTO stated that the average age of taxis in the Philippines is 9 years. An
operation manager of a large taxi company selects a sample of 40 taxis and finds the
average age of the taxis is 8.2 years. The o of the population is 2.3 years. At a = 0.05,
can it be concluded that the average age of the taxis in his company is less than the
national average?
Solution:
Step 1: State the hypotheses.
Ho:
H::
Step 2: The level of significance and critical region. a =
and zcritical =
Step 3: Compute for the value of one sample z test. Zcomputed
Step 4: Decision rule.
Step 5: Conclusion.
Expert Solution
This question has been solved!
Explore an expertly crafted, step-by-step solution for a thorough understanding of key concepts.

This is a popular solution

Trending nowThis is a popular solution!

Step by stepSolved in 2 steps with 2 images

Knowledge Booster


Learn more about
Need a deep-dive on the concept behind this application? Look no further. Learn more about this topic, statistics and related others by exploring similar questions and additional content below.Similar questions
- In a population-based cohort study, an entire community was interviewed regarding smoking habits and then followed for one year. Upon ascertainment of all lung cancer deaths, the investigator obtained the following data: Number of Individuals Lung Cancer Deaths Smokers 24,500 15 Nonsmokers 10,500 2 Calculate the risk difference per 100,000 per year. Round to the tenth decimaarrow_forwardwhat is 1. P value 2. Z value 3. Critical value 4. Reject or do not reject 5. State conclusionarrow_forward13) In a clinical study of an allergy drug, 115 of the 260 subjects reported experiencing significant relief from their symptoms. From the data, a 90% C.I. for the percentage of all subjects reported experiencing significant relief from their symptoms is (,blank ), blank (round to the 3rd decimal place).arrow_forward
- The recidivism rate for convicted sex offenders is 12%. A warden suspects that this percent is different if the sex offender is also a drug addict. Of the 322 convicted sex offenders who were also drug addicts, 48 of them became repeat offenders. What can be concluded at the a = 0.01 level of significance? a. For this study, we should use z-test for a population proportion V b. The null and alternative hypotheses would be: Ho: ? v Select an answer (please enter a decimal) H1: ? v Select an answer v (Please enter a decimal) c. The test statistic ? v = (please show your answer to 3 decimal places.) d. The p-value = (Please show your answer to 4 decimal places.) e. The p-value is ? V a f. Based on this, we should Select an answer v the null hypothesis. g. Thus, the final conclusion is that ... O The data suggest the population proportion is not significantly different from 12% at a = 0.01, so there is statistically insignificant evidence to conclude that the population proportion of…arrow_forward1. A dog groomer is often asked if small dogs bark more than larger dogs. To test this, he logs the number of separate barking episodes per day for three size dogs: small, medium, and large. In a separate file you will find the number of barking episodes for 12 dogs. On average, small dogs barked the most Mean: 7.25 On average, medium sized dogs barked the least Mean: 2.75 A. Do the different size dogs bark a significantly different number of times? Test with an α = 0.05. B. If appropriate, use Tukey’s HSD post hoc test and report where the differences are. If inappropriate, state why. C. Calculate and interpret the effect size.arrow_forwardIdentify the correct null hypothesis (from the below choices) for each: 1. A study wished to see if husbands or wives are more satisfied in their marriage. They selected 100 married couples and asked both the husband and wives to rate their satisfaction on a scale of 1 to 10. [Select] 2. A study wished to see if husbands or wives are more satisfied in their marriage. They selected a 100 married men and 100 married women and asked them rate their satisfaction on a scale of 1 to 10. [Select] 3. A study wished to see if husbands or wives are more satisfied in their marriage. From a previous study the average score (from 1 to 10) of wives was 6.5. They selected a sample of 100 married men and asked them to rate their satisfaction on a scale of 1 to 10. [Select]arrow_forward
- Dr. Maddan's eye drops are supposed to cause significant reduction is eye redness. The following table shows the results of a recent study where a random sample of individuals took part in a placebo controlled study. No Reduction in Redness Reduction in Redness Total Eye Drops 120 220 340 No Eye Drops Total 120 140 260 240 360 600 With 5% level of significance, determine if eye redness reduction is dependent upon taking the eye drops. Provide, a. the Chi-square statistic. b. the critical value or the p-value. c. Your decision on whether or not to reject Ho.arrow_forwardI only need help with the (((((((RED X'S))))))arrow_forward
arrow_back_ios
arrow_forward_ios
Recommended textbooks for you
- MATLAB: An Introduction with ApplicationsStatisticsISBN:9781119256830Author:Amos GilatPublisher:John Wiley & Sons Inc
 Probability and Statistics for Engineering and th...StatisticsISBN:9781305251809Author:Jay L. DevorePublisher:Cengage Learning
 Statistics for The Behavioral Sciences (MindTap C...StatisticsISBN:9781305504912Author:Frederick J Gravetter, Larry B. WallnauPublisher:Cengage Learning
  Elementary Statistics: Picturing the World (7th E...StatisticsISBN:9780134683416Author:Ron Larson, Betsy FarberPublisher:PEARSON
 The Basic Practice of StatisticsStatisticsISBN:9781319042578Author:David S. Moore, William I. Notz, Michael A. FlignerPublisher:W. H. Freeman
 Introduction to the Practice of StatisticsStatisticsISBN:9781319013387Author:David S. Moore, George P. McCabe, Bruce A. CraigPublisher:W. H. Freeman
MATLAB: An Introduction with Applications
Statistics
ISBN:9781119256830
Author:Amos Gilat
Publisher:John Wiley & Sons Inc
Probability and Statistics for Engineering and th...
Statistics
ISBN:9781305251809
Author:Jay L. Devore
Publisher:Cengage Learning
Statistics for The Behavioral Sciences (MindTap C...
Statistics
ISBN:9781305504912
Author:Frederick J Gravetter, Larry B. Wallnau
Publisher:Cengage Learning
Elementary Statistics: Picturing the World (7th E...
Statistics
ISBN:9780134683416
Author:Ron Larson, Betsy Farber
Publisher:PEARSON
The Basic Practice of Statistics
Statistics
ISBN:9781319042578
Author:David S. Moore, William I. Notz, Michael A. Fligner
Publisher:W. H. Freeman
Introduction to the Practice of Statistics
Statistics
ISBN:9781319013387
Author:David S. Moore, George P. McCabe, Bruce A. Craig
Publisher:W. H. Freeman