MATLAB: An Introduction with Applications
6th Edition
ISBN: 9781119256830
Author: Amos Gilat
Publisher: John Wiley & Sons Inc
expand_more
expand_more
format_list_bulleted
Concept explainers
Question
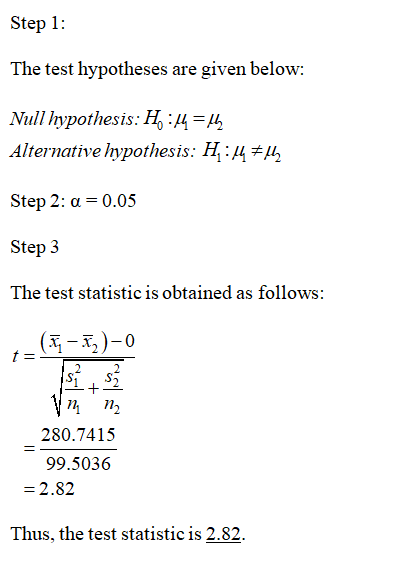
A market researcher wanted to evaluate the difference in credit charges for customers of Bracy’s. She randomly selected 100 customers and recorded their credit charges in December 2004 and January 2005. Is there evidence to show a difference in credit charges between the two months?
Step 1: Step 2: α =
Ho:
H1:
Step 3 Step 4
Step 5 Step 6
Difference: Dec. 2004 - Jan. 2005
Sample Diff: 280.74152
Std. Err: 99.50361
p-value: 0.0058
Expert Solution
arrow_forward
Step 1

Step by stepSolved in 2 steps with 2 images

Knowledge Booster
Learn more about
Need a deep-dive on the concept behind this application? Look no further. Learn more about this topic, statistics and related others by exploring similar questions and additional content below.Similar questions
- Fill in the missing values for this ANOVA summary table: Source of Variation SS df MS F Between 1313.964 2 Within TOTAL 2795.964 15 Accordong to the given information, how many groups (or population means) are being compared using this ANOVA? (Hint: Use the df values to compute it) what is the total number of data used for this ANOVA? (Hint: Use the df values to compute it)arrow_forwardIn a mass screening of 1,000 65-year-old men in 2002, 100 were found to have diabetes. During the following 10-year period another 200 contracted diabetes. What was the prevalence of diabetes in 2002? What was the prevalence in 2012? i a haveing a hard time understanding how to calculate there measuresarrow_forwardTo determine if their 0.33 centimeter bolts are properly adjusted, Harper Manufacturing has decided to use an x‾-Chart which uses the range to estimate the variability in the sample. Average value 0.370 Step 1 of 7: What is the Center Line of the control chart? Round your answer to three decimal places. Step 2 of 7: What is the Upper Control Limit? Round your answer to three decimal places. Step 3 of 7: What is the Lower Control Limit? Round your answer to three decimal places. Step 4 of 7: Use the following sample data, taken from the next time period, to determine if the process is "In Control" or "Out of Control".Observations: 0.38,0.31,0.36,0.31,0.36,0.370.38,0.31,0.36,0.31,0.36,0.37Sample Mean: 0.34830.3483 Step 5 of 7: Use the following sample data, taken from the next time period, to determine if the process is "In Control" or "Out of Control".Observations:…arrow_forward
- The control department of a light bulb manufacturer randomly picks 4400 light bulbs from the production lot every week. The records show that, when there is no malfunction, the defect rate in the manufacturing process (due to imperfections in the material used) is 1%. When 1.25%o or more of the light bulbs in the sample of 4400 are defective, the control unit calls repair technicians for service. Answer the following. (If necessary, consult a list of formulas.) (a) Find the mean of p, where p is the proportion of defective light bulbs in a sample of 4400 when there is no malfunction. (b) Find the standard deviation of p. (c) Compute an approximation for P(p N 0.0125), which is the probability that the service technicians will be called even though the system is functioning properly. Round your answer to four decimal places.arrow_forwardanswer blankarrow_forwardYou are conducting a study to see if the proportion of women over 40 who regularly have mammograms is significantly different from 0.22. Your sample data produce the test statistic z = 3.03 . Find the pvalue accurate to 4 decimal places.arrow_forward
arrow_back_ios
arrow_forward_ios
Recommended textbooks for you
 MATLAB: An Introduction with ApplicationsStatisticsISBN:9781119256830Author:Amos GilatPublisher:John Wiley & Sons Inc
 Probability and Statistics for Engineering and th...StatisticsISBN:9781305251809Author:Jay L. DevorePublisher:Cengage Learning
 Statistics for The Behavioral Sciences (MindTap C...StatisticsISBN:9781305504912Author:Frederick J Gravetter, Larry B. WallnauPublisher:Cengage Learning
 Elementary Statistics: Picturing the World (7th E...StatisticsISBN:9780134683416Author:Ron Larson, Betsy FarberPublisher:PEARSON
 The Basic Practice of StatisticsStatisticsISBN:9781319042578Author:David S. Moore, William I. Notz, Michael A. FlignerPublisher:W. H. Freeman
 Introduction to the Practice of StatisticsStatisticsISBN:9781319013387Author:David S. Moore, George P. McCabe, Bruce A. CraigPublisher:W. H. Freeman

MATLAB: An Introduction with Applications
Statistics
ISBN:9781119256830
Author:Amos Gilat
Publisher:John Wiley & Sons Inc

Probability and Statistics for Engineering and th...
Statistics
ISBN:9781305251809
Author:Jay L. Devore
Publisher:Cengage Learning

Statistics for The Behavioral Sciences (MindTap C...
Statistics
ISBN:9781305504912
Author:Frederick J Gravetter, Larry B. Wallnau
Publisher:Cengage Learning

Elementary Statistics: Picturing the World (7th E...
Statistics
ISBN:9780134683416
Author:Ron Larson, Betsy Farber
Publisher:PEARSON

The Basic Practice of Statistics
Statistics
ISBN:9781319042578
Author:David S. Moore, William I. Notz, Michael A. Fligner
Publisher:W. H. Freeman

Introduction to the Practice of Statistics
Statistics
ISBN:9781319013387
Author:David S. Moore, George P. McCabe, Bruce A. Craig
Publisher:W. H. Freeman