
MATLAB: An Introduction with Applications
6th Edition
ISBN: 9781119256830
Author: Amos Gilat
Publisher: John Wiley & Sons Inc
expand_more
expand_more
format_list_bulleted
Related questions
Question
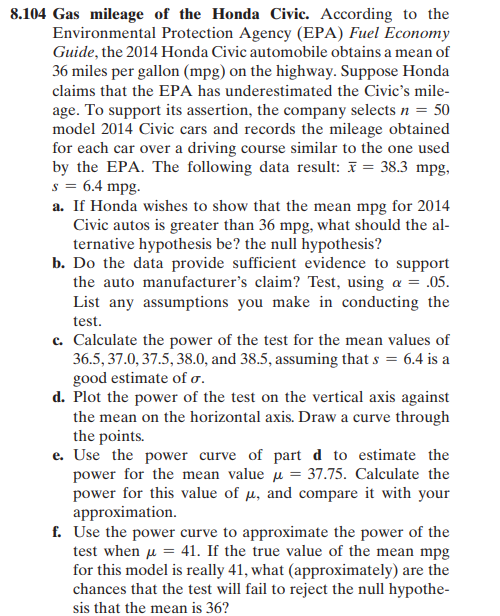

Transcribed Image Text:8.104 Gas mileage of the Honda Civic. According to the
Environmental Protection Agency (EPA) Fuel Economy
Guide, the 2014 Honda Civic automobile obtains a mean of
36 miles per gallon (mpg) on the highway. Suppose Honda
claims that the EPA has underestimated the Civic's mile-
age. To support its assertion, the company selects n = 50
model 2014 Civic cars and records the mileage obtained
for each car over a driving course similar to the one used
by the EPA. The following data result: x = 38.3 mpg,
s = 6.4 mpg.
a. If Honda wishes to show that the mean mpg for 2014
Civic autos is greater than 36 mpg, what should the al-
ternative hypothesis be? the null hypothesis?
b. Do the data provide sufficient evidence to support
the auto manufacturer's claim? Test, using a = .05.
List any assumptions you make in conducting the
test.
c. Calculate the power of the test for the mean values of
36.5, 37.0, 37.5, 38.0, and 38.5, assuming that s = 6.4 is a
good estimate of σ.
d. Plot the power of the test on the vertical axis against
the mean on the horizontal axis. Draw a curve through
the points.
e. Use the power curve of part d to estimate the
power for the mean value = 37.75. Calculate the
power for this value of μ, and compare it with your
approximation.
f. Use the power curve to approximate the power of the
test when μ = 41. If the true value of the mean mpg
for this model is really 41, what (approximately) are the
chances that the test will fail to reject the null hypothe-
sis that the mean is 36?
Expert Solution
This question has been solved!
Explore an expertly crafted, step-by-step solution for a thorough understanding of key concepts.

This is a popular solution

Trending nowThis is a popular solution!

Step by stepSolved in 3 steps

Knowledge Booster

Similar questions
- he level of cretaine phosphokinase (CPK) in blood samples measures the amount of muscle damage for athletes. At Jock State University, the level of CPK was determined for each of 25 football players and 15 soccer players before and after practice. The two groups of athletes are trained independently. The data summary is as follows : For football players: Data for Football players n=25 Before Practice After Practice Difference (Before-After) Mean 254.73 225.6 29.13 Standard deviation 115.5 132.6 21.00 For soccer players: Data for Soccer players n=15 Before Practice After Practice Difference (Before-After) Mean 177.1 173.8 3.3 Standard deviation 60.7 64.4 6.88 Assume that all the data above are normal Test the claim that the mean CPK level has DECREASED for soccer players AFTER exercise (compared to the mean BEFORE exercise), using α=0.10. AFTER practice, do football players have a DIFFERENT mean CPK values compared to soccer players? Test this claim by…arrow_forwardCathy makes a single deposit into an account earning 2.5% compounded monthly. After five years the account contains $3057.46.how much did she deposit?arrow_forwardThe following set of data represents the number of orders filled by a national-chain restaurant during a two week period. Construct a five number summary for the the data. 66, 75, 68, 89, 86, 73, 67, 75, 75, 82, 85, 74, 67, 61 (Round to the nearest hundredth, if needed). Min _________________ Lower Quartile _________________ Median __________________ Upper Quartile _________________ Maximum __________________ What is the range and the interquartile range (IQR)? Range __________________ Interquartile Range (IQR) ___________________arrow_forward
- In a study of the effects of the drug THC on driving performance, driving performance would be the Independent variable. a. true b. falsearrow_forwardUse the following cell phone airport data speeds (Mbps) from a particular network. Find the percentile corresponding to the data speed 0.9 Mbps. 0.2 0.2 0.3 0.4 0.4 0.6 0.6 0.7 0.7 0.7 0.8 0.8 0.9 0.9 0.9 0.9 1.2 1.3 1.8 1.9 1.9 2.3 2.3 2.4 2.4 2.9 3.1 3.3 3.9 4.6 4.7 5.2 5.3 5.6 6.3 7.1 7.1 7.7 8.3 8.4 8.8 9.6 9.8 9.9 13.4 13.8 13.9 14.4 15.7arrow_forwardUse the following cell phone airport data speeds (Mbps) from a particular network. Find the percentile corresponding to the data speed 9.6 Mbps. 0.1 0.1 0.2 0.2 0.3 0.4 0.4 0.4 0.5 0.5 0.5 0.5 0.7 0.8 0.8 0.9 0.9 1.2 1.2 1.3 1.5 1.5 1.8 2.1 2.2 2.4 2.4 2.7 3.7 3.8 3.9 4.8 5.1 5.5 6.2 6.2 6.3 7.7 8.8 9.3 9.3 9.6 9.8 11.8 13.9 14.1 14.7 15.5 15.7 28.3arrow_forward
- Use the following cell phone airport data speeds (Mbps) from a particular network. Find the percentile corresponding to the data speed 0.9 Mbps. 0.6 0.6 0.7 0.7 D 0.5 0.5 0.6 0.2 0.4 0.5 1.4 1.5 1.6 0.9 1.2 1.4 0.7 0.9 0.9 2.8 3.2 0.7 2.5 2.5 2.6 1.9 2.2 2.3 8.8 1.6 1.7 8.2 8.2 8.3 5.7 6.6 6.7 3.6 3.7 4.9 15.3 15.5 30.6 14.8 15.1 15.3 11.9 14.5 8.9 9.1 ..... Percentile of 0.9 = (Round to the nearest whole number as needed.) Next MacBook DII DD F12 F11 F10 F9 000 000 F8 F7 F5 F6 F4 esc F3 F1 @ # $ del 7 2 4 { } E R T Y U Q W tab G H J K L F A + II * 00arrow_forwardResearchers examined the influence of a television program on children's aggressiveness. The number of aggressive responses was measured during an observation period after viewing the television program. Imagine that the known national average for number of aggressive responses typically performed by children who do not watch television is 6.847. Use the data below to conduct an analysis to determine if the number of aggressive responses on average is different from the national average. The data for this study can be found below, answer questions based on data. What is the null and alternative hypotheses in words and symbols? Is the assumption(s) met? Please explain your answer and proceed with the analysis even if the assumption(s) is not met. What do you conclude from your analysis? Based on your response in “c” above, identify and explain the type of error you could be making. responses 9 4 11 12 14 7 12 10 11 8 14 12 8 12 7 10 10 9 5…arrow_forwardArsenic is toxic to humans and people can be exposed to it through contaminated drinking water, food, dust, and soil. Scientists have devised a non-invasive way to measure a person's level of arsenic poisoning: by examining toenail clippings. In a recent study, scientists measure the level of arsenic (in mg/kg) in toenail clippings of 8 people who lived near a former arsenic mine in Great Britain. The following levels are recorded. 0.8, 1.9, 2.7, 3.4, 3.9, 7.1, 11.9, 26.0 Below are the summary statistics of the data. min Q1 median Q3 max sd n mean 0.8 2.5 3.65 8.3 26 7.2125 8.368041 8 Suppose the 8 people examined were randomly sampled from residents near the former arsenic mine. Is it legitimate to construct a 95% confidence interval for the mean level of arsenic (in mg/kg) in toenail clippings for residents near the former arsenic mine using a t-distribution? Explain briefly.arrow_forward
- The authors of a paper were interested in how the distance a deer mouse will travel for food is related to the distance from the food to the nearest pile of debris. Distances were measured in meters. The data and computer output are given below. Distance from Debris Distance Traveled 6.94 0.00 5.23 6.13 5.21 11.29 7.10 14.35 8.16 12.03 5.50 22.72 9.19 20.11 9.05 26.16 9.36 30.65 Simple Linear Regression Results: Dependent Variable: Traveled Independent Variable: Debris Sample size: 9 R (correlation coefficient) = 0.5657 R-sq = 0.32002088 Estimate of error standard deviation 8.670711 Parameter estimates: Parameter Estimate Std. Err. Alternative DF T-Stat P-Value Intercept -7.6854587 13.332196 ≠ 0 7 -0.5764586 0.5824 Slope 3.2340908 1.7818117 ≠ 0 7 1.8150575 0.1124 a)What is the least squares regression line for the output given above? b) what is the predicted traveled distance given the distance from debris is 6.5 meters?arrow_forwardA physical therapist wanted to know whether the mean step pulse of men was less than the mean step pulse of women. She randomly selected 59 men and 73 women to participate in the study. Each subject was required to step up and down a 6-inch platform. The pulse of each subject was then recorded. The following results were obtained. SE Mean 1.5 1.7 SIDev 11.2 Mean 112.7 Men Women 99% CI for mu Men - mu Women -11.89, 0.09) T-Test mu Men mu Women (vs<) T= -2.61 P=0.0051 DF 129 59 73 118.6 14.8 Two sample T for Men vs Women State the researcher's condlusion. Which of the following is correct? O A Reject Ha, there is sufficient evidence to condlude that the mean step pulse of men was less than the mean step pulse of women the mean step pulse of women O B. Reject Ha, there is not sufficient evidence to condlude that the mean step pulse of men was less OC. Fail to reject Ho, there is sufficient evidence to conclude that the mean step pulse of men was less than the mean steg pulse of women O D.…arrow_forwardSuppose you are interested in the population of all college students in the US and that you collect data from all students from FIT. Is the following a parameter or statistic? The proportion of your school's students who are Business Majors a. parameter b. statisticarrow_forward
arrow_back_ios
SEE MORE QUESTIONS
arrow_forward_ios
Recommended textbooks for you
- MATLAB: An Introduction with ApplicationsStatisticsISBN:9781119256830Author:Amos GilatPublisher:John Wiley & Sons Inc
 Probability and Statistics for Engineering and th...StatisticsISBN:9781305251809Author:Jay L. DevorePublisher:Cengage Learning
 Statistics for The Behavioral Sciences (MindTap C...StatisticsISBN:9781305504912Author:Frederick J Gravetter, Larry B. WallnauPublisher:Cengage Learning
  Elementary Statistics: Picturing the World (7th E...StatisticsISBN:9780134683416Author:Ron Larson, Betsy FarberPublisher:PEARSON
 The Basic Practice of StatisticsStatisticsISBN:9781319042578Author:David S. Moore, William I. Notz, Michael A. FlignerPublisher:W. H. Freeman
 Introduction to the Practice of StatisticsStatisticsISBN:9781319013387Author:David S. Moore, George P. McCabe, Bruce A. CraigPublisher:W. H. Freeman
MATLAB: An Introduction with Applications
Statistics
ISBN:9781119256830
Author:Amos Gilat
Publisher:John Wiley & Sons Inc
Probability and Statistics for Engineering and th...
Statistics
ISBN:9781305251809
Author:Jay L. Devore
Publisher:Cengage Learning
Statistics for The Behavioral Sciences (MindTap C...
Statistics
ISBN:9781305504912
Author:Frederick J Gravetter, Larry B. Wallnau
Publisher:Cengage Learning
Elementary Statistics: Picturing the World (7th E...
Statistics
ISBN:9780134683416
Author:Ron Larson, Betsy Farber
Publisher:PEARSON
The Basic Practice of Statistics
Statistics
ISBN:9781319042578
Author:David S. Moore, William I. Notz, Michael A. Fligner
Publisher:W. H. Freeman
Introduction to the Practice of Statistics
Statistics
ISBN:9781319013387
Author:David S. Moore, George P. McCabe, Bruce A. Craig
Publisher:W. H. Freeman