
Biology (MindTap Course List)
11th Edition
ISBN: 9781337392938
Author: Eldra Solomon, Charles Martin, Diana W. Martin, Linda R. Berg
Publisher: Cengage Learning
expand_more
expand_more
format_list_bulleted
Concept explainers
Videos
Textbook Question
Chapter 53, Problem 20TYU
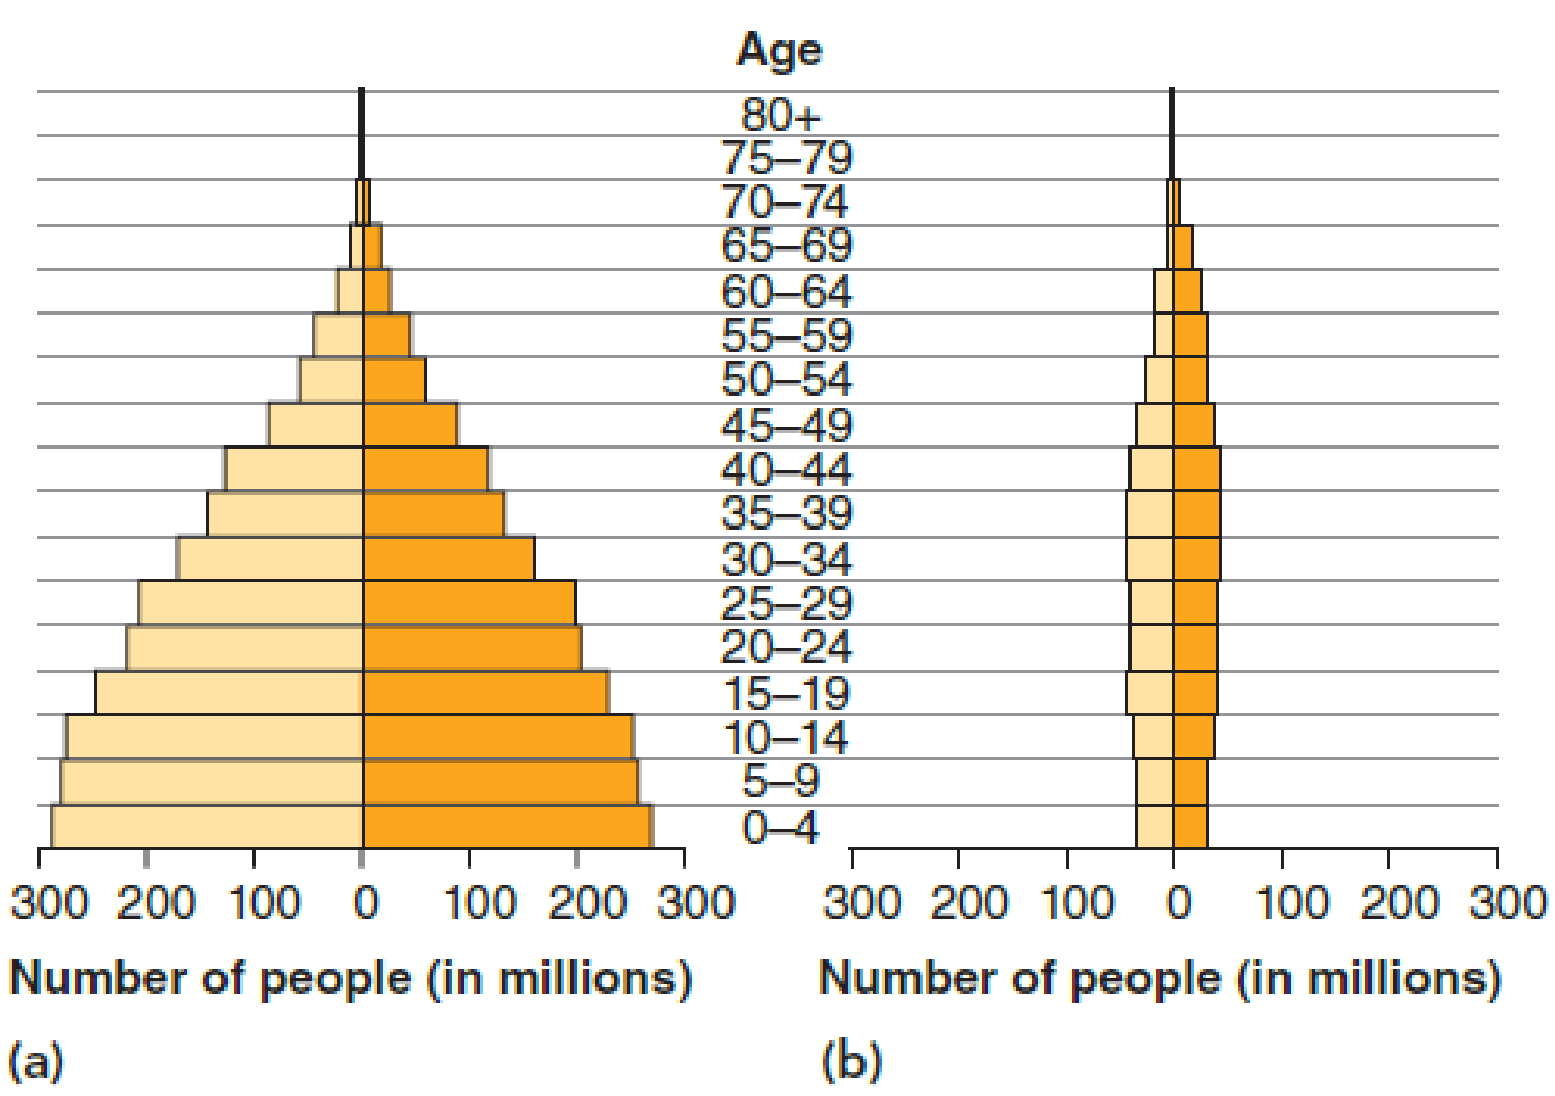
INTERPRET DATA Consider the age structure diagrams for counties (a) and (b). Which diagram is consistent with negative growth momentum? Why?
KEY
Expert Solution & Answer

Trending nowThis is a popular solution!

Students have asked these similar questions
With the help of suitable diagram describe the logistic population growth curve.
Thebest model for population growth of an annual plant like Phlox drummondii is:a.geometric growth.b.exponential growth.c.logistic growth.d.geometric growth during years with high rainfall and exponential growthduring years with low rainfall.e.geometric growth during years with high rainfall and logistic growthduring years with low rainfall.
These data were collected over a 5-year period for a perennial compass plant. What is the rate of growth of the population if the carrying capacity is 1000 (using 202 for starting population size)? What is the fastest rate of growth possible for this population?
Chapter 53 Solutions
Biology (MindTap Course List)
Ch. 53.1 - Define population density and dispersion, and...Ch. 53.1 - What is the difference between population density...Ch. 53.1 - What are some biological advantages of a clumped...Ch. 53.2 - Prob. 2LOCh. 53.2 - Define intrinsic rate of increase and carrying...Ch. 53.2 - Prob. 1CCh. 53.2 - Prob. 2CCh. 53.2 - Prob. 3CCh. 53.3 - Contrast the influences of density-dependent and...Ch. 53.3 - What are three examples of density-dependent...
Ch. 53.3 - What are three density-independent factors?Ch. 53.4 - Contrast semelparous and iteroparous reproduction.Ch. 53.4 - Distinguish among species exhibiting an r...Ch. 53.4 - Prob. 7LOCh. 53.4 - What are the advantages of semelparity? of...Ch. 53.4 - Prob. 2CCh. 53.4 - Prob. 3CCh. 53.5 - Prob. 8LOCh. 53.5 - Prob. 1CCh. 53.6 - Prob. 9LOCh. 53.6 - Prob. 10LOCh. 53.6 - Distinguish between people overpopulation and...Ch. 53.6 - Prob. 1CCh. 53.6 - Prob. 2CCh. 53.6 - How can a single child born in the United States...Ch. 53 - Population _______________ is the number of...Ch. 53 - The per capita growth rate of a population where...Ch. 53 - The maximum rate at which a population could...Ch. 53 - When r is a positive number, the population size...Ch. 53 - In a graph of population size versus time, a...Ch. 53 - The largest population that can be maintained by a...Ch. 53 - Giant bamboos live many years without reproducing,...Ch. 53 - Predation, disease, and competition are examples...Ch. 53 - _______________ competition occurs within a...Ch. 53 - Prob. 10TYUCh. 53 - Prob. 11TYUCh. 53 - Which of the following patterns of cars parked...Ch. 53 - Prob. 13TYUCh. 53 - Prob. 14TYUCh. 53 - Prob. 15TYUCh. 53 - Prob. 16TYUCh. 53 - Prob. 17TYUCh. 53 - Prob. 18TYUCh. 53 - Prob. 19TYUCh. 53 - INTERPRET DATA Consider the age structure diagrams...Ch. 53 - SCIENCE, TECHNOLOGY, AND SOCIETY In what ways has...
Additional Science Textbook Solutions
Find more solutions based on key concepts
Police Captain Jeffers has suffered a myocardial infarction. a. Explain to his (nonmedically oriented) family w...
Human Physiology: An Integrated Approach (8th Edition)
What are the cervical and lumbar enlargements?
Principles of Anatomy and Physiology
1. Genetics affects many aspects of our lives. Identify three ways genetics affects your life or the life of a ...
Genetic Analysis: An Integrated Approach (2nd Edition)
Why is it unlikely that two neighboring water molecules would be arranged like this?
Campbell Biology (11th Edition)
Why is it unlikely that two neighboring water molecules would be arranged like this?
Campbell Biology (10th Edition)
Knowledge Booster


Learn more about
Need a deep-dive on the concept behind this application? Look no further. Learn more about this topic, biology and related others by exploring similar questions and additional content below.Similar questions
- Describe the growth at various parts of the S-shaped curve of logistic growth.arrow_forwardINTERPRET DATA Examine the top and middle graphs in Figure 54-5. Are these examples of exponential or logistic population growth? Where is K in each graph? (You may need to refer to Chapter 53 to answer these questions.) RESULTS AND CONCLUSION: The top and middle graphs show how each species of Paramecium flourishes when grown alone. The bottom graph shows how they grow together, in competition with each other. In a mixed culture, P. aurelia outcompetes P. caudatum, resulting in competitive exclusion. SOURCE: Adapted from G.F. Gause, The Struggle for Existence (Williams and Wilkins, Baltimore, 1934). Figure 54-5 G.F. Gauses classic experiment on interspecific competitionarrow_forwardDraw the general shape of age structure diagrams characteristic of (a) expanding, (b) stable, and (c) shrinking populations. Label all the axes. Explain why you can predict the next several decades of growth by the current age structure of populations.arrow_forward
- Show how you build the logistic model for population growth from the exponential model equation? What part of the logistic growth equation produces the sigmoidal growth curve?arrow_forwardExplain why a constant per capita rate of growth (r) for apopulation produces a curve that is J-shaped.arrow_forwardafter the bamboo fruiting: In reality, this high carrying capacity cannot be sustained for longer than a few weeks.When the bamboo fruits and rice run out, the carrying capacity reverts to the levelobserved before the bamboo began to fruit. A). Describe what is happening to the population size.arrow_forward
- Compare exponential J-curve growth (line A) to logistic S-curve growth (line B). Explain the conditions under which each might occur in might. ✓ ✓ A Carrying Capacity (K) it Number of Individuals B Timearrow_forwardExplain what carrying capacity means and give the similarities/differences for exponential growth and logistic growth along with the factors that might affect them. will upvote if correctarrow_forwardWrite a generalized model for exponential population growth. Define your terms. Then, draw a plot showing an example, being sure to label your axes. Write a formula that extends the preceding model to incorporate carrying capacity, producing sigmoidal population growth. Define your terms. Then, draw a plot showing an example, being sure to label your axes.arrow_forward
- Describe how each of the limiting factors in the simulation affected population growth and carrying capacity(migration, predation, food, disease, and pollution). Include a reason why you think the limiting factor affected the population growth in this way.arrow_forwardYou monitor the white-tailed deer population for the Wright State campus and woods and estimate 14 deer in the first year and 21 deer in the second year. (A) Assume the deer population is growing geometrically. Based on these data, what is geometric growth rate constant (A)? (B) Geometric growth patterns can also be modeled exponentially. If modeled exponentially, would you expect the exponential growth rate constant () to be greater than, less than, or equal to 0? Why? You monitor the deer population for many years. The population grows for a few more years, then seems to stabilize around 75 deer. (C) Given this information, what would be a more appropriate model for the deer population growth? Why? (D) What factors might be limiting the population growth? Would these factors be considered density-dependent or density- independent factors? Why? it is equal to zero. The correct answer is not displayed for Written Response type questions. Hide Feedback (A) Check geometric growth…arrow_forwardThe maximum sustainable yield (MSY) is the highest rate at which a potentially renewable resource can be used indefinitely without reducing its available supply. The idea is to remove individuals while keeping the population at a constant growth rate and size, but to find the size where the harvest is maximized. The greater the growth rate, the more individuals you can remove and not change the population size. Where is the growth rate at its maximum? To find this look at your logistic model simulator. 1. Set up a hypothetical salmon population where the carrying capacity is 20,000 fish, the maximumr is 0.7. According the the maximum sustainable yield (MSY), at what population size should we maintain the salmon while fishing?arrow_forward
arrow_back_ios
SEE MORE QUESTIONS
arrow_forward_ios
Recommended textbooks for you
 Biology (MindTap Course List)BiologyISBN:9781337392938Author:Eldra Solomon, Charles Martin, Diana W. Martin, Linda R. BergPublisher:Cengage Learning
 Concepts of BiologyBiologyISBN:9781938168116Author:Samantha Fowler, Rebecca Roush, James WisePublisher:OpenStax College
Biology (MindTap Course List)
Biology
ISBN:9781337392938
Author:Eldra Solomon, Charles Martin, Diana W. Martin, Linda R. Berg
Publisher:Cengage Learning
Concepts of Biology
Biology
ISBN:9781938168116
Author:Samantha Fowler, Rebecca Roush, James Wise
Publisher:OpenStax College
Explore Terrestrial Habitats - Types of Habitats for Children; Author: Smile and Learn - English;https://www.youtube.com/watch?v=vv1indKgOHQ;License: Standard youtube license