
Concept explainers
Videos
Income Elasticity of Demand: Computer Usage in the 1990s The following graph shows the probability q that a household in the 1990s with annual income x dollars had a computer, together with the logarithmic curve
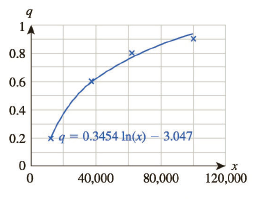
a. Compute the income elasticity of demand for computers, to two decimal places, for a household income of $60,000, and interpret the result.
b. As household income increases, how is income elasticity of demand affected?
c. How reliable is the given model of demand for incomes well above $120,000? Explain. d. What can you say about E for incomes much larger than those shown?
Want to see the full answer?
Check out a sample textbook solution
Chapter 12 Solutions
Finite Mathematics and Applied Calculus (MindTap Course List)


- Sales of a video game released in the year 2000 took off at first, but then steadily slowed as time moved on. Table 4 shows the number of games sold, in thousands, from the years 20002010. a. Let x represent time in years starting with x=1 for the year 2000. Let y represent the number of games sold in thousands. Use logarithmic regression to fit a model to these data. b. If games continue to sell at this rate, how many games will sell in 2015? Round to the nearest thousand.arrow_forwardEquipment Insurance A piece of equipment is being insured against early failure. The time from purchase until failure of the equipment is exponentially distributed with mean 10 years. The insurance will pay an amount x if failure occurs during the first year, and it will pay 0.5x if failure occurs during the second or third year. If failure occurs after the three years, no payment will be made. At what level must x be set if the expected payment made under this insurance is to be 1000? Source: Society of Actuaries. Choose one of the following. a.3858 b.4449 c.5382 d.5644 e.7235arrow_forwardEnter the data from Table 2 into a graphing calculator and graph the ranking scatter plot. Determine whetherthe data from the table would likely represent a function that is linear, exponential, or logarithmic.arrow_forward
- Fruit Flies A study of the relation between the rate of reproduction in Drosophila fruit flies bred in bottles and the density of the mated population found that the number of imagoes sexually mature adults per mated female per day y can be approximated by logy=1.54-0.008x-0.658logx, Where x is the mean density of the mated population measured as flies per bottle over a 16-day period. Source: Elements of Mathematical Biology. a. Show that the above equation is equivalent to y=34.71.0186-xx-0.658. b. Using your answer from part a, find the number of imagoes per mated female per day when the density is i. 20 flies per bottle; ii. 40 flies per bottle. c. Using your answer from part a, find the rate of change in the number of imagoes per mated female per day with respect to the density when the density is, i. 20 flies per bottle; ii. 40 flies per bottle.arrow_forwardWhat type (s) of translation(s), if any, affect the range of a logarithmic function?arrow_forwardWhat situations are best modeled by a logistic equation? Give an example, and state a case for why the example is a good fit.arrow_forward

 Calculus For The Life SciencesCalculusISBN:9780321964038Author:GREENWELL, Raymond N., RITCHEY, Nathan P., Lial, Margaret L.Publisher:Pearson Addison Wesley,
 Algebra & Trigonometry with Analytic GeometryAlgebraISBN:9781133382119Author:SwokowskiPublisher:Cengage
 Algebra and Trigonometry (MindTap Course List)AlgebraISBN:9781305071742Author:James Stewart, Lothar Redlin, Saleem WatsonPublisher:Cengage Learning
 College AlgebraAlgebraISBN:9781305115545Author:James Stewart, Lothar Redlin, Saleem WatsonPublisher:Cengage Learning