
Finite Mathematics and Applied Calculus (MindTap Course List)
7th Edition
ISBN: 9781337274203
Author: Stefan Waner, Steven Costenoble
Publisher: Cengage Learning
expand_more
expand_more
format_list_bulleted
Concept explainers
Videos
Question
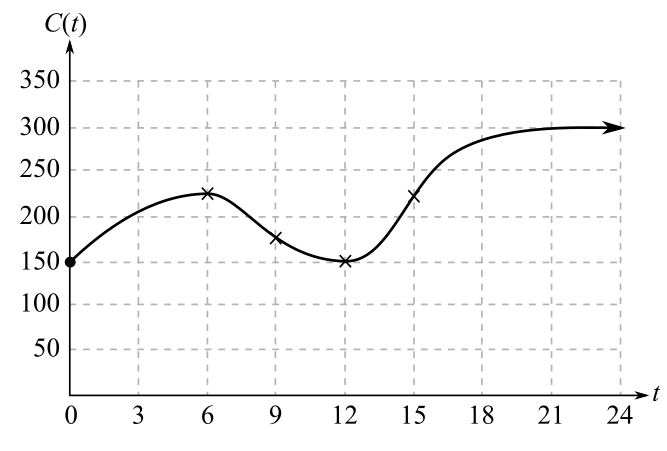
Chapter 12.4, Problem 31E
To determine
The important features of the provided graph and interpretation of each feature in terms of median home price.
Expert Solution & Answer
Want to see the full answer?
Check out a sample textbook solution
Students have asked these similar questions
World Military Expenditure The following chart shows total military and arms trade expenditure from 2011–2020 (t = 1 represents 2011).
†A bar graph titled "World military expenditure" has a horizontal t-axis labeled "Year since 2010" and a vertical axis labeled "$ (billions)". The bar graph has 10 bars. Each bar is associated with a label and an approximate value as listed below.
1: 1,800 billion dollars
2: 1,775 billion dollars
3: 1,750 billion dollars
4: 1,730 billion dollars
5: 1,760 billion dollars
6: 1,760 billion dollars
7: 1,850 billion dollars
8: 1,900 billion dollars
9: 1,950 billion dollars
10: 1,980 billion dollars
(a)
If you want to model the expenditure figures with a function of the form
f(t) = at2 + bt + c,
would you expect the coefficient a to be positive or negative? Why? HINT [See "Features of a Parabola" in this section.]
We would expect the coefficient to be positive because the curve is concave up.
We would expect the coefficient to be negative because the…
Cell Phones Using the CTIA Wireless Survey for1985–2009, the number of U.S. cell phone subscribers (in millions) can be modeled byy = 0.632x2 - 2.651x + 1.209where x is the number of years after 1985.a. Graphically find when the number of U.S.subscribers was 301,617,000.b. When does the model estimate that the number ofU.S. subscribers would reach 359,515,000?c. What does the answer to (b) tell about this model?
U.S. Population The number of White non-Hispanicindividuals in the U.S. civilian non-institutional population 16 years and older was 153.1 million in 2000and is projected to be 169.4 million in 2050.(Source: U.S. Census Bureau)a. Find the average annual rate of change in population during the period 2000–2050, with the appropriate units.b. Use the slope from part (a) and the population in2000 to write the equation of the line associatedwith 2000 and 2050.c. What does this model project the population to bein 2020?
Chapter 12 Solutions
Finite Mathematics and Applied Calculus (MindTap Course List)
Ch. 12.1 - In Exercises 112, locate and classify all extrema...Ch. 12.1 - In Exercises 112, locate and classify all extrema...Ch. 12.1 - In Exercises 112, locate and classify all extrema...Ch. 12.1 - In Exercises 112, locate and classify all extrema...Ch. 12.1 - In Exercises 112, locate and classify all extrema...Ch. 12.1 - In Exercises 112, locate and classify all extrema...Ch. 12.1 - In Exercises 112, locate and classify all extrema...Ch. 12.1 - In Exercises 112, locate and classify all extrema...Ch. 12.1 - In Exercises 112, locate and classify all extrema...Ch. 12.1 - In Exercises 112, locate and classify all extrema...
Ch. 12.1 - In Exercises 112, locate and classify all extrema...Ch. 12.1 - In Exercises 112, locate and classify all extrema...Ch. 12.1 - In Exercises 13-44, find the exact location of all...Ch. 12.1 - In Exercises 13-44, find the exact location of all...Ch. 12.1 - Prob. 15ECh. 12.1 - Prob. 16ECh. 12.1 - In Exercises 13-44, find the exact location of all...Ch. 12.1 - In Exercises 13-44, find the exact location of all...Ch. 12.1 - Prob. 19ECh. 12.1 - In Exercises 13-44, find the exact location of all...Ch. 12.1 - In Exercises 13-44, find the exact location of all...Ch. 12.1 - In Exercises 13-44, find the exact location of all...Ch. 12.1 - In Exercises 13-44, find the exact location of all...Ch. 12.1 - Prob. 24ECh. 12.1 - In Exercises 13-44, find the exact location of all...Ch. 12.1 - Prob. 26ECh. 12.1 - Prob. 27ECh. 12.1 - Prob. 28ECh. 12.1 - In Exercises 13-44, find the exact location of all...Ch. 12.1 - In Exercises 13-44, find the exact location of all...Ch. 12.1 - In Exercises 13-44, find the exact location of all...Ch. 12.1 - Prob. 32ECh. 12.1 - In Exercises 13-44, find the exact location of all...Ch. 12.1 - Prob. 34ECh. 12.1 - Prob. 35ECh. 12.1 - Prob. 36ECh. 12.1 - In Exercises 13-44, find the exact location of all...Ch. 12.1 - Prob. 38ECh. 12.1 - In Exercises 13-44, find the exact location of all...Ch. 12.1 - Prob. 40ECh. 12.1 - In Exercises 13-44, find the exact location of all...Ch. 12.1 - Prob. 42ECh. 12.1 - In Exercises 13-44, find the exact location of all...Ch. 12.1 - Prob. 44ECh. 12.1 - In Exercises 4548, use graphing technology and the...Ch. 12.1 - Prob. 46ECh. 12.1 - Prob. 47ECh. 12.1 - Prob. 48ECh. 12.1 - In Exercises 4956 the graph of the derivative of a...Ch. 12.1 - Prob. 50ECh. 12.1 - In Exercises 4956 the graph of the derivative of a...Ch. 12.1 - Prob. 52ECh. 12.1 - In Exercises 4956 the graph of the derivative of a...Ch. 12.1 - Prob. 54ECh. 12.1 - Prob. 55ECh. 12.1 - Prob. 56ECh. 12.1 - Prob. 57ECh. 12.1 - Prob. 58ECh. 12.1 - Draw the graph of a function that has stationary...Ch. 12.1 - Prob. 60ECh. 12.1 - Prob. 61ECh. 12.1 - Prob. 62ECh. 12.1 - We said that if f is continuous on a closed...Ch. 12.1 - Prob. 64ECh. 12.1 - Prob. 65ECh. 12.1 - Prob. 66ECh. 12.2 - In Exercises 1-8, solve the given optimization...Ch. 12.2 - In Exercises 1-8, solve the given optimization...Ch. 12.2 - In Exercises 1-8, solve the given optimization...Ch. 12.2 - In Exercises 1-8, solve the given optimization...Ch. 12.2 - In Exercises 1-8, solve the given optimization...Ch. 12.2 - Prob. 6ECh. 12.2 - Prob. 7ECh. 12.2 - Prob. 8ECh. 12.2 - For a rectangle with perimeter 20 to have the...Ch. 12.2 - Prob. 10ECh. 12.2 - Advertising Costs The cost, in thousands of...Ch. 12.2 - Advertising Costs The cost, in billions of...Ch. 12.2 - Average Cost: iPhones Assume that it costs Apple...Ch. 12.2 - Prob. 14ECh. 12.2 - Prob. 15ECh. 12.2 - Prob. 16ECh. 12.2 - Prob. 17ECh. 12.2 - Prob. 18ECh. 12.2 - Fences I would like to create a rectangular...Ch. 12.2 - Fences I would like to create a rectangular orchid...Ch. 12.2 - Prob. 21ECh. 12.2 - Prob. 22ECh. 12.2 - Fences (Compare Exercise 19.) For tax reasons I...Ch. 12.2 - Fences (Compare Exercise 20.) For reasons too...Ch. 12.2 - Revenue Hercules Films is deciding on the price of...Ch. 12.2 - Prob. 26ECh. 12.2 - Prob. 27ECh. 12.2 - Projected Revenue: Smartphones Worldwide annual...Ch. 12.2 - Revenue: Monorail Service The demand for monorail...Ch. 12.2 - Prob. 30ECh. 12.2 - Prob. 31ECh. 12.2 - Prob. 32ECh. 12.2 - Prob. 33ECh. 12.2 - Prob. 34ECh. 12.2 - Profit: Smartphones (Compare Exercise 27.)...Ch. 12.2 - Projected Profit: Smartphones (Compare Exercise...Ch. 12.2 - Prob. 37ECh. 12.2 - Profit Because of sales by a competing company,...Ch. 12.2 - Prob. 39ECh. 12.2 - Metal Drums A company manufactures cylindrical...Ch. 12.2 - Tin Cans A company manufactures cylindrical tin...Ch. 12.2 - Prob. 42ECh. 12.2 - Prob. 43ECh. 12.2 - Prob. 44ECh. 12.2 - Box Design A packaging company is going to make...Ch. 12.2 - Prob. 46ECh. 12.2 - Prob. 47ECh. 12.2 - Carry-on Dimensions American Airlines requires...Ch. 12.2 - Prob. 49ECh. 12.2 - Prob. 50ECh. 12.2 - Package Dimensions The U.S. Postal Service (USPS)...Ch. 12.2 - Prob. 52ECh. 12.2 - Prob. 53ECh. 12.2 - Cellphone Revenues (Refer to Exercise 53.) If we...Ch. 12.2 - Prob. 55ECh. 12.2 - Prob. 56ECh. 12.2 - Prob. 57ECh. 12.2 - Prob. 58ECh. 12.2 - Prob. 59ECh. 12.2 - Prob. 60ECh. 12.2 - Average Profit The FeatureRich Software Company...Ch. 12.2 - Prob. 62ECh. 12.2 - Prob. 63ECh. 12.2 - Resource Allocation Your company is the largest...Ch. 12.2 - Prob. 65ECh. 12.2 - Prob. 66ECh. 12.2 - Prob. 67ECh. 12.2 - Prison Population The prison population in the...Ch. 12.2 - Prob. 69ECh. 12.2 - Prob. 70ECh. 12.2 - Prob. 71ECh. 12.2 - Prob. 72ECh. 12.2 - Prob. 73ECh. 12.2 - Prob. 74ECh. 12.2 - Prob. 75ECh. 12.2 - Agriculture Two years ago, your orange orchard...Ch. 12.2 - Prob. 77ECh. 12.2 - Prob. 78ECh. 12.2 - Prob. 79ECh. 12.2 - Prob. 80ECh. 12.2 - Prob. 81ECh. 12.2 - Prob. 82ECh. 12.2 - Prob. 83ECh. 12.2 - Prob. 84ECh. 12.2 - Prob. 85ECh. 12.2 - Explain how you would solve an optimization...Ch. 12.3 - In Exercises 1-10, calculate d2ydx2. [HINT: See...Ch. 12.3 - Prob. 2ECh. 12.3 - In Exercises 1-10, calculate d2ydx2. [HINT: See...Ch. 12.3 - Prob. 4ECh. 12.3 - In Exercises 1-10, calculate d2ydx2. [HINT: See...Ch. 12.3 - Prob. 6ECh. 12.3 - In Exercises 1-10, calculate d2ydx2. [HINT: See...Ch. 12.3 - In Exercises 1-10, calculate d2ydx2. [HINT: See...Ch. 12.3 - In Exercises 1-10, calculate d2ydx2. [HINT: See...Ch. 12.3 - Prob. 10ECh. 12.3 - In Exercises 1116 the position s of a point (in...Ch. 12.3 - In Exercises 1116 the position s of a point (in...Ch. 12.3 - Prob. 13ECh. 12.3 - In Exercises 1116 the position s of a point (in...Ch. 12.3 - In Exercises 1116 the position s of a point (in...Ch. 12.3 - Prob. 16ECh. 12.3 - Prob. 17ECh. 12.3 - Prob. 18ECh. 12.3 - Prob. 19ECh. 12.3 - Prob. 20ECh. 12.3 - Prob. 21ECh. 12.3 - Prob. 22ECh. 12.3 - In Exercises 1724 the graph of a function is...Ch. 12.3 - Prob. 24ECh. 12.3 - Prob. 25ECh. 12.3 - Prob. 26ECh. 12.3 - Prob. 27ECh. 12.3 - Prob. 28ECh. 12.3 - Prob. 29ECh. 12.3 - Prob. 30ECh. 12.3 - Prob. 31ECh. 12.3 - Prob. 32ECh. 12.3 - Prob. 33ECh. 12.3 - In Exercises 3344, find the x-coordinates of all...Ch. 12.3 - Prob. 35ECh. 12.3 - Prob. 36ECh. 12.3 - Prob. 37ECh. 12.3 - Prob. 38ECh. 12.3 - Prob. 39ECh. 12.3 - Prob. 40ECh. 12.3 - Prob. 41ECh. 12.3 - Prob. 42ECh. 12.3 - Prob. 43ECh. 12.3 - Prob. 44ECh. 12.3 - Prob. 45ECh. 12.3 - Prob. 46ECh. 12.3 - Prob. 47ECh. 12.3 - Prob. 48ECh. 12.3 - Prob. 49ECh. 12.3 - Prob. 50ECh. 12.3 - Prob. 51ECh. 12.3 - Prob. 52ECh. 12.3 - Prob. 53ECh. 12.3 - Prob. 54ECh. 12.3 - Acceleration on Mars If a stone is dropped from a...Ch. 12.3 - Prob. 56ECh. 12.3 - Motion in a Straight Line The position of a...Ch. 12.3 - Motion in a Straight Line The position of a...Ch. 12.3 - Bottled Water Sales Annual sales of bottled water...Ch. 12.3 - Bottled Water Sales Annual U.S. per capita sales...Ch. 12.3 - Embryo Development The daily oxygen consumption of...Ch. 12.3 - Embryo Development The daily oxygen consumption of...Ch. 12.3 - Inflation The following graph shows the...Ch. 12.3 - Prob. 64ECh. 12.3 - Inflation The following graph shows the...Ch. 12.3 - Inflation The following graph shows the...Ch. 12.3 - Prob. 67ECh. 12.3 - Scientific Research: 19832003 The percentage of...Ch. 12.3 - Prob. 69ECh. 12.3 - Prob. 70ECh. 12.3 - Prob. 71ECh. 12.3 - Prob. 72ECh. 12.3 - Epidemics The following graph shows the total...Ch. 12.3 - Prob. 74ECh. 12.3 - Prob. 75ECh. 12.3 - Prob. 76ECh. 12.3 - Prob. 77ECh. 12.3 - Prob. 78ECh. 12.3 - Prob. 79ECh. 12.3 - Prob. 80ECh. 12.3 - Oil Imports from Mexico Daily oil production in...Ch. 12.3 - Oil Imports from Mexico Repeat Exercises 81 using...Ch. 12.3 - Prob. 83ECh. 12.3 - Prob. 84ECh. 12.3 - Prob. 85ECh. 12.3 - Prob. 86ECh. 12.3 - Prob. 87ECh. 12.3 - Prob. 88ECh. 12.3 - Prob. 89ECh. 12.3 - Prob. 90ECh. 12.3 - Prob. 91ECh. 12.3 - Prob. 92ECh. 12.3 - Prob. 93ECh. 12.3 - Prob. 94ECh. 12.3 - Prob. 95ECh. 12.3 - Prob. 96ECh. 12.3 - Prob. 97ECh. 12.3 - Prob. 98ECh. 12.4 - In Exercises 126, sketch the graph of the given...Ch. 12.4 - In Exercises 126, sketch the graph of the given...Ch. 12.4 - In Exercises 126, sketch the graph of the given...Ch. 12.4 - Prob. 4ECh. 12.4 - Prob. 5ECh. 12.4 - Prob. 6ECh. 12.4 - Prob. 7ECh. 12.4 - Prob. 8ECh. 12.4 - Prob. 9ECh. 12.4 - Prob. 10ECh. 12.4 - Prob. 11ECh. 12.4 - Prob. 12ECh. 12.4 - In Exercises 126, sketch the graph of the given...Ch. 12.4 - Prob. 14ECh. 12.4 - Prob. 15ECh. 12.4 - Prob. 16ECh. 12.4 - Prob. 17ECh. 12.4 - Prob. 18ECh. 12.4 - Prob. 19ECh. 12.4 - In Exercises 126, sketch the graph of the given...Ch. 12.4 - Prob. 21ECh. 12.4 - Prob. 22ECh. 12.4 - Prob. 23ECh. 12.4 - Prob. 24ECh. 12.4 - Prob. 25ECh. 12.4 - Prob. 26ECh. 12.4 - Prob. 27ECh. 12.4 - Prob. 28ECh. 12.4 - Prob. 29ECh. 12.4 - Prob. 30ECh. 12.4 - Prob. 31ECh. 12.4 - Prob. 32ECh. 12.4 - Prob. 33ECh. 12.4 - Prob. 34ECh. 12.4 - Consumer Price Index The following graph shows the...Ch. 12.4 - Prob. 36ECh. 12.4 - Prob. 37ECh. 12.4 - Prob. 38ECh. 12.4 - Average Cost: iPhone Assume that is costs Apple...Ch. 12.4 - Average Cost: PlayStation 4s Assume that it costs...Ch. 12.4 - Prob. 41ECh. 12.4 - Subprime Mortgage Debt during the Housing Bubble...Ch. 12.4 - Prob. 43ECh. 12.4 - Prob. 44ECh. 12.4 - Prob. 45ECh. 12.4 - Prob. 46ECh. 12.4 - Prob. 47ECh. 12.4 - Prob. 48ECh. 12.4 - Prob. 49ECh. 12.4 - Prob. 50ECh. 12.5 - Rewrite the statements and questions in Exercises...Ch. 12.5 - Rewrite the statements and questions in Exercises...Ch. 12.5 - Rewrite the statements and questions in Exercises...Ch. 12.5 - Rewrite the statements and questions in Exercises...Ch. 12.5 - Prob. 5ECh. 12.5 - Prob. 6ECh. 12.5 - Prob. 7ECh. 12.5 - Prob. 8ECh. 12.5 - Sunspots The area of a circular sunspot is growing...Ch. 12.5 - Puddles The radius of a circular puddle is growing...Ch. 12.5 - Prob. 11ECh. 12.5 - Prob. 12ECh. 12.5 - End of the Earth In 5 billion years the Sun will...Ch. 12.5 - Prob. 14ECh. 12.5 - Sliding Ladders The base of a 50-foot ladder is...Ch. 12.5 - Prob. 16ECh. 12.5 - Prob. 17ECh. 12.5 - Prob. 18ECh. 12.5 - Prob. 19ECh. 12.5 - Average Cost Repeat Exercise 19, using the revised...Ch. 12.5 - Prob. 21ECh. 12.5 - Supply The number of retro portable CD players you...Ch. 12.5 - Revenue You can now sell 50 cups of lemonade per...Ch. 12.5 - Prob. 24ECh. 12.5 - Prob. 25ECh. 12.5 - Oil Expenditures Daily oil imports to the United...Ch. 12.5 - Resource Allocation Your company manufactures...Ch. 12.5 - Prob. 28ECh. 12.5 - Prob. 29ECh. 12.5 - Prob. 30ECh. 12.5 - Prob. 31ECh. 12.5 - Demand The demand equation for rubies at Royal...Ch. 12.5 - Prob. 33ECh. 12.5 - Prob. 34ECh. 12.5 - Baseball A baseball diamond is a square with side...Ch. 12.5 - Prob. 36ECh. 12.5 - Movement along a Graph A point on the graph of...Ch. 12.5 - Prob. 38ECh. 12.5 - Prob. 39ECh. 12.5 - Prob. 40ECh. 12.5 - Prob. 41ECh. 12.5 - Prob. 42ECh. 12.5 - Cones A right circular conical vessel is being...Ch. 12.5 - More Cones A circular conical vessel is being...Ch. 12.5 - Prob. 45ECh. 12.5 - Prob. 46ECh. 12.5 - Prob. 47ECh. 12.5 - Computers vs. Income Refer back to the model in...Ch. 12.5 - Prob. 49ECh. 12.5 - Prob. 50ECh. 12.5 - Prob. 51ECh. 12.5 - Prob. 52ECh. 12.5 - Prob. 53ECh. 12.5 - Prob. 54ECh. 12.5 - Prob. 55ECh. 12.5 - Prob. 56ECh. 12.5 - Prob. 57ECh. 12.5 - Prob. 58ECh. 12.5 - Prob. 59ECh. 12.5 - Prob. 60ECh. 12.5 - Prob. 61ECh. 12.5 - Prob. 62ECh. 12.6 - Demand for Oranges The weekly sales of Honolulu...Ch. 12.6 - Demand for Oranges Repeat Exercise 1 for weekly...Ch. 12.6 - Demand for Smartphones Worldwide annual sales of...Ch. 12.6 - Prob. 4ECh. 12.6 - Prob. 5ECh. 12.6 - Monorail Services The demand for monorail service...Ch. 12.6 - Tissues The consumer demand equation for tissues...Ch. 12.6 - Bodybuilding The consumer demand curve for...Ch. 12.6 - T-Shirts The Physics Club sells E=mc2 T-shirts at...Ch. 12.6 - Comics The demand curve for original Iguanawoman...Ch. 12.6 - E-Readers The demand for Amazons Kindle e-reader...Ch. 12.6 - Monorail Service on Mars The demand for monorail...Ch. 12.6 - Corn In the 1930s the economist Henry Schultz...Ch. 12.6 - Demand for Fried Chicken A fried chicken franchise...Ch. 12.6 - Paint-By-Number The estimated monthly sales of...Ch. 12.6 - Prob. 16ECh. 12.6 - Prob. 17ECh. 12.6 - Prob. 18ECh. 12.6 - Hyperbolic Demand Functions A general hyperbolic...Ch. 12.6 - Quadratic Demand Functions A general quadratic...Ch. 12.6 - Modeling Linear Demand You have been hired as a...Ch. 12.6 - Modeling Linear Demand You have been hired as a...Ch. 12.6 - Modeling Exponential Demand As the new owner of a...Ch. 12.6 - Prob. 24ECh. 12.6 - Income Elasticity of Demand: Live Drama The...Ch. 12.6 - Prob. 26ECh. 12.6 - Income Elasticity of Demand: Broadband in 2010 The...Ch. 12.6 - Prob. 28ECh. 12.6 - Income Elasticity of Demand: Computer Usage in the...Ch. 12.6 - Prob. 30ECh. 12.6 - Prob. 31ECh. 12.6 - Price Elasticity of Supply Given a supply equation...Ch. 12.6 - Income Elasticity of Demand (based on a question...Ch. 12.6 - Prob. 34ECh. 12.6 - Prob. 35ECh. 12.6 - Prob. 36ECh. 12.6 - Prob. 37ECh. 12.6 - Prob. 38ECh. 12.6 - Prob. 39ECh. 12.6 - Prob. 40ECh. 12 - In Exercises 18, find all the relative and...Ch. 12 - Prob. 2RECh. 12 - Prob. 3RECh. 12 - Prob. 4RECh. 12 - Prob. 5RECh. 12 - Prob. 6RECh. 12 - Prob. 7RECh. 12 - Prob. 8RECh. 12 - Prob. 9RECh. 12 - Prob. 10RECh. 12 - Prob. 11RECh. 12 - Prob. 12RECh. 12 - Prob. 13RECh. 12 - Prob. 14RECh. 12 - Prob. 15RECh. 12 - Prob. 16RECh. 12 - Prob. 17RECh. 12 - Prob. 18RECh. 12 - Prob. 19RECh. 12 - Prob. 20RECh. 12 - Prob. 21RECh. 12 - Prob. 22RECh. 12 - Revenue Demand for the latest best-seller at...Ch. 12 - Prob. 24RECh. 12 - Prob. 25RECh. 12 - Prob. 26RECh. 12 - Office Space Although still a sophomore at...Ch. 12 - Prob. 28RECh. 12 - Box Design The sales department at...Ch. 12 - Prob. 30RECh. 12 - Prob. 31RECh. 12 - Prob. 32RECh. 12 - Prob. 33RECh. 12 - Prob. 34RECh. 12 - Elasticity of Demand (Compare Exercise 23.) Demand...Ch. 12 - Prob. 36RECh. 12 - Prob. 37RECh. 12 - Prob. 38RE
Knowledge Booster


Learn more about
Need a deep-dive on the concept behind this application? Look no further. Learn more about this topic, calculus and related others by exploring similar questions and additional content below.Similar questions
- the operating expesnes of amazon increased from 3.6 billion in 2008 to 16.3 billion in 2012. use the information to find a linear model for amazons operating expesne E as a function of time t in years since 2010arrow_forwardFigure a. shows world population, in billions, for seven selected years from 1950 through 2010. A scatter plot is shown in Figure b. Suggest two types of functions that would be good choices for modeling the data.arrow_forwardSketch the graph of the function y = 2xarrow_forward
- The graph models the population of a baceria colony B(d) as a function of the time, d, in days passed.arrow_forwardThe data in Table indicate that between the ages of 1 and 11, the human brain does not grow linearly, or steadily. A scatter plot for the data is shown in Figure . What type of function would be a good choice for modeling the data?arrow_forwardThe value of the Conference Board Index of 10 economic indicators in the United States could be approximated by the following function of time t in months since the end of December 2015arrow_forward
- Among all deaths from a particular disease, the percentage that is smoking related (21–39 cigarettes per day) is a function of the disease’s incidence ratio. The incidence ratio describes the number of times more likely smokers are than nonsmokers to die from the disease. The following table shows the incidence ratios for heart disease and lung cancer for two age groups. For example, the incidence ratio of 9 in the given table means that smokers between the ages of 65 and 74 are 9 times more likely than nonsmokers in the same age group to die from lung cancer. The rational function P(x) = 100(x - 1)/x, models the percentage of smoking-related deaths among all deaths from a disease, P(x), in terms of the disease’s incidence ratio, x. The graph of the rational function is shown. Use this function to solve, What is the horizontal asymptote of the graph? Describe what this means about the percentage of deaths caused by smoking with increasing incidence ratios.arrow_forwardAmong all deaths from a particular disease, the percentage that is smoking related (21–39 cigarettes per day) is a function of the disease’s incidence ratio. The incidence ratio describes the number of times more likely smokers are than nonsmokers to die from the disease. The following table shows the incidence ratios for heart disease and lung cancer for two age groups. For example, the incidence ratio of 9 in the given table means that smokers between the ages of 65 and 74 are 9 times more likely than nonsmokers in the same age group to die from lung cancer. The rational function P(x) = 100(x - 1)/x, models the percentage of smoking-related deaths among all deaths from a disease, P(x), in terms of the disease’s incidence ratio, x. The graph of the rational function is shown. Use this function to solve, Find P(10). Describe what this means in terms of the incidence ratio, 10, given in the table. Identify your solution a point on the graph.arrow_forwardThe following graph shows the average American household debt h as a function of the date d.arrow_forward
- Sketch a rough graph of the yield of a crop as a function of the amount of fertilizer used.arrow_forward49. The raccoon population in a large wooded area over a 10-year period is shown. Use the graph to estimate the vertical shift of the function.arrow_forwardIs this table a linear function ?arrow_forward
arrow_back_ios
SEE MORE QUESTIONS
arrow_forward_ios
Recommended textbooks for you

 Glencoe Algebra 1, Student Edition, 9780079039897...AlgebraISBN:9780079039897Author:CarterPublisher:McGraw Hill
 Algebra & Trigonometry with Analytic GeometryAlgebraISBN:9781133382119Author:SwokowskiPublisher:Cengage
Glencoe Algebra 1, Student Edition, 9780079039897...
Algebra
ISBN:9780079039897
Author:Carter
Publisher:McGraw Hill
Algebra & Trigonometry with Analytic Geometry
Algebra
ISBN:9781133382119
Author:Swokowski
Publisher:Cengage
Finding Local Maxima and Minima by Differentiation; Author: Professor Dave Explains;https://www.youtube.com/watch?v=pvLj1s7SOtk;License: Standard YouTube License, CC-BY