
Concept explainers
Videos
Scientific Research: 1983–2003 The percentage of research articles in the prominent journal Physical Review that were written by researchers in Europe during 1983–2003 can be modeled by
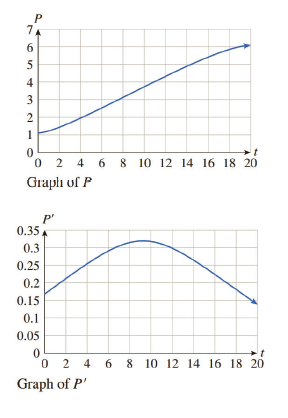
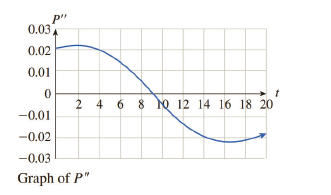
Determine, to the nearest whole number, the values of t for which the graph of P is concave up and where it is concave down, and locate any points of inflection. What does the point of inflection tell you about science articles? [HINT: See Example 4.]

Trending nowThis is a popular solution!

Chapter 12 Solutions
Finite Mathematics and Applied Calculus (MindTap Course List)


- Each of Exercises 81–84 shows the graphs of the first and second derivatives of a function y = f(x). Copy the picture and add to it a sketch of the approximate graph of f, given that the graph passes through the point P.arrow_forwardQ1. The table provided gives data on indexes of output per hour (X) and real compensation per hour (Y) for the business and nonfarm business sectors of the U.S. economy for 1960–2005. The base year of the indexes is 1992 = 100 and the indexes are seasonally adjusted. a. Plot Y against X for the two sectors separately. b. What is the economic theory behind the relationship between the two variables? Does the scattergram support the theory? c. Estimate the OLS regression of Y on X. Note: on the table ( 1. Output refers to real gross domestic product in the sector. 2. Wages and salaries of employees plus employers’ contributions for social insurance and private benefit plans. 3. Hourly compensation divided by the consumer price index for all urban consumers for recent quarters.) Thank you!arrow_forwardThis question has several parts that must be completed sequentially. The following table shows total military and arms trade expenditure for a certain country in 2000, 2006, and 2012. Year t (year since 2000) 0 6 12 Military Expenditure C(t)($ billion) 40 270 510 (a) Compute and interpret the average rate of change of C(t) over the period 2006–2012 (that is, [6, 12]). Be sure to state the units of measurement. (b) Compute and interpret the average rate of change of C(t) over the period [0, 12]. Be sure to state the units of measurement. Recall that the average rate of change of f(x) over the interval [a, b] is the change in f divided by the change in x. The symbol Δ means "change in." average rate of change of f = change in f change in x = Δf Δx = f(b) − f(a) b − a Note that the given chart provides data points in the form of (t, C(t)). Year t (year since 2000) 0 6 12 Military Expenditure C(t)($ billion) 40 270 510 In the…arrow_forward
- National Debt The size of the total debt owed by the UnitedStates federal government continues to grow. In fact,according to the Department of the Treasury, the debt perperson living in the United States is approximately $53,000(or over $140,000 per U.S. household). The following datarepresent the U.S. debt for the years 2001–2014. Since thedebt D depends on the year y, and each input correspondsto exactly one output, the debt is a function of the year. SoD1y2 represents the debt for each year y. Source: www.treasurydirect.govDebt (billions Debt (billionsYear of dollars) Year of dollars)2001 5807 2008 10,0252002 6228 2009 11,9102003 6783 2010 13,5622004 7379 2011 14,7902005 7933 2012 16,0662006 8507 2013 16,7382007 9008 2014 17,824 (a) Plot the points 12001, 58072, 12002, 62282, and so on ina Cartesian plane.(b) Draw a line segment from the point 12001, 58072 to12006, 85072. What does the slope of this line segmentrepresent?(c) Find the average rate of change of the debt from 2002…arrow_forwardproblen 1.1arrow_forward1.9 Write the equation that results in the desired transformation: The graph of y = x³, vertically compressed by a factor of 0.8. y = 0.8 a. b. y = (x – 0.8)³ С. y = (x + 0.8)³ d. y = 0.8x³arrow_forward
- The file P02_26.xlsx lists sales (in millions of dollars) of Dell Computer during the period 1987–1997 (where year 1 corresponds to 1987). Year Sales 1 69 2 159 3 258 4 389 5 546 6 890 7 2014 8 2873 9 3475 10 5296 11 7759 a. Fit a power and an exponential trend curve to these data. Which fits the data better? b. Use your part a answer to predict 1999 sales for Dell. c. Use your part a answer to describe how the sales of Dell have grown from year to year.arrow_forwardThe amount of domestic waste, W, in millions of metric tons, dumped in landfills dropped from 22.42 in 2001 to 2.17 in 2019 in England.¹ Find a formula for W as a linear function of year t. W = +arrow_forwardListed below are the numbers of deaths resulting from motor vehicle crashes. Let x represent the year, with 1975 coded as x = 1, 1980 coded as x = 6, 1985 coded as x = 11, and so on. Construct a scatterplot and identify the mathematical model that best fits the given data. Use the best model to find the projected number of deaths for the year 2028. x (year) 1975 1980 1985 1990 1995 2000 2005 2010 D y (deaths) 44,533 51,122 43,809 44,590 41,798 41,960 43,436 32,697 (...) Choose the correct graph below. O A. O B. O C. D. 52000- 52000- 52000- 52000- DDDD 00 X X X X 32000+ 32000 32000+ 32000+ 0 40 0 40 0 40 0 40 What is the equation of the best model? Select the correct choice below and fill in the answer boxes to complete your choice. Enter only nonzero values. (Type integers or decimals rounded to three decimal places as needed.) O A. y= X B. y = + In x O C. y = + O D. X y=² O E. y = x² + X + Use the best model to find the projected number of such deaths for the year 2028. The projected…arrow_forward
- 1.2 number 12 reviewarrow_forward7.8.7 d) in the early 1970s there were approximately 40,000 trees lining the streets of Newton. Today, that number is about 26,000-a 35% loss. The current annual rate of decline is about 650 trees per year. At this rate, if unchecked, public street trees would diminish to approximately 10,000 within a generation (25 years), and in 40 years, public street trees would no longer be part of the Newton landscape. a-c will be answered in the picture attached a) check the arithmetic that leads to the claimed "35% loss" b) check the arithmetic that leads to a "current annual rate of 650 trees per year". c) check the predictions in the last sentence. are they likely to come to pass? now, using the information in the paragraph and the questions + work shown, answer d) d) write the equation for the linear model implicit in this quotation (use years since 2012 as the independent variable). identify the slope and the intercept, with their units.arrow_forwardFind a formula for each of the functions graphed below. AA AN 17. mff VALA 19. 20. Section 6.1 Sinusoidal Graphs 411 -13-12-11-10ELJAarrow_forward
 Algebra & Trigonometry with Analytic GeometryAlgebraISBN:9781133382119Author:SwokowskiPublisher:Cengage