To calculate: To make a
Answer to Problem 7.8.1EP
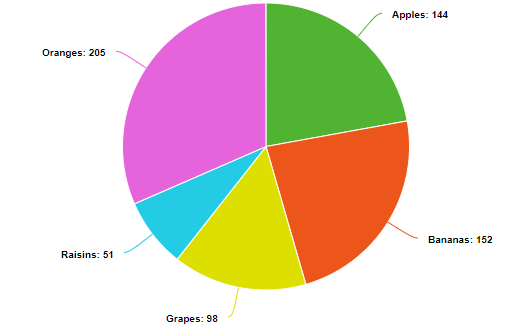
Circle graph is plotted
Explanation of Solution
Given information: During a recent lunch period, the cafeteria staff took a survey to find out which type of fruit the students preferred. The choices and results are listed in the table below:
| Fruit | Number of votes |
| Apples | 144 |
| Bananas | 152 |
| Grapes | 98 |
| Raisins | 51 |
| Oranges | 205 |
Formula Used:
Portion is circle graph is calculated
Calculation:
Percentage of votes for Apples
Percentage of votes for Bananas
Percentage of votes for Grapes
Percentage of votes for Raisins
Percentage of votes for Oranges
On making circle graph,

Conclusion:
Hence, circle graph is plotted
Chapter SH Solutions
Pre-Algebra Student Edition
Additional Math Textbook Solutions
Thinking Mathematically (6th Edition)
Elementary Statistics: Picturing the World (7th Edition)
University Calculus: Early Transcendentals (4th Edition)
College Algebra (7th Edition)
- a) [1√2-31x+1√3-11y = x (1 - √2) + √34 LI√2-21x-1√3-3/4= √34 - √2x-4arrow_forwardPlease Help me answer this linear algebra question. This is a practice textbook question.arrow_forward1. a scientist observed a bacterium in a microscope. it measured about .0000029 meter in diameter which of the following is closest to it? A- 2 x 10^-6, B- 2 x 10^-5, C- 3 x 10^-5, or D- 3 x 10^-6 2.express the product of 500 and 400 in scientific notation. is it 2 x 10^5 or 2 x 10^4 or 2 x 10^3 or 20 x 10^4arrow_forward
- Please Help me answer this linear algebra question. This is a practice textbook question.arrow_forwardPlease Help me answer this linear algebra question. This is a practice textbook question.arrow_forwardTY D om E h om ng 00 C B A G F Q ו 3 13 Details Find an Euler path for the graph. Enter your response as a sequence of vertices in the order they are visited, for example, ABCDEA. fic ► Question Help: Video Message instructor Submit Question tor arch 園 A Wind advisoryarrow_forward
- You are provided with three 2D data points, p1, p2 and p3. Solving A C = B for C provides youwith the coefficients of a natural cubic spline curve that interpolates these points.Additionally, you have been given A and B, but some elements are missing. Moreover, the last two rowsof A are entirely absent. Your task is to determine and fill in the missing elements. For the last two rows,enforce a zero tangent at the beginning (in p1) and a not-a-knot boundary condition in p2. The matricesA and B are given as follows:Explain how to find the entries of A and B . How would you adapt these matrices if the data pointswere 3D? What if your spline should go through five data points? How many “extra rows” would there thenbe (with “extra” meaning “in addition to securing C2-continuity”)?arrow_forwardWhich graph represents f(x) = √x-2+3?arrow_forwardPractice Assignment 5.6 Rational Functions M Practice Assig Practice Assignment 5.6 Rational Functions Score: 120/150 Answered: 12/15 Question 10 A Write an equation for the function graphed below 5 + 4 1 2 H + + -7 -6 -5 -4 -3 -2 -1 2 34567 | -2 ర y = Question Help: Video Message instructor Post to forum Submit Questionarrow_forward
 Algebra and Trigonometry (6th Edition)AlgebraISBN:9780134463216Author:Robert F. BlitzerPublisher:PEARSON
 Contemporary Abstract AlgebraAlgebraISBN:9781305657960Author:Joseph GallianPublisher:Cengage Learning
 Linear Algebra: A Modern IntroductionAlgebraISBN:9781285463247Author:David PoolePublisher:Cengage Learning
 Algebra And Trigonometry (11th Edition)AlgebraISBN:9780135163078Author:Michael SullivanPublisher:PEARSON
 Introduction to Linear Algebra, Fifth EditionAlgebraISBN:9780980232776Author:Gilbert StrangPublisher:Wellesley-Cambridge Press
 College Algebra (Collegiate Math)AlgebraISBN:9780077836344Author:Julie Miller, Donna GerkenPublisher:McGraw-Hill Education


