
i.
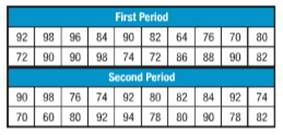
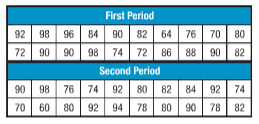
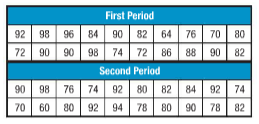
Calculate the mean, median and mode for given classes.
i.
Answer to Problem 13.1MPS
For first period,
Mean =83.7
Median = 85
Mode = 90
For second period,
Mean =82.3
Median = 81
Mode = 92
Explanation of Solution
Given:
Calculations:
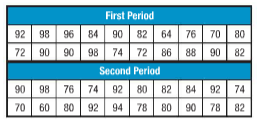
Here, we have to calculate mean, median and mode for given data.
Mean is the average of given set of data.
Mean for first period is
Mean for second period is
Median is the centered value of given data.
Median for first period is
64, 70, 72, 72, 74, 76, 80, 82, 82, 84, 86, 88, 90, 90, 90, 90, 92, 96, 98, 98
Median is the centered value of given data.
Median for first period is
60, 70, 74, 74, 76, 78, 78, 80, 80, 80, 82, 82, 84, 90, 90, 92, 92, 92, 94, 98
Mode is the frequent value in given data.
Thus, in first period, 90 is mode.
In second period, 92 is mode.
Conclusion:
Therefore, we are able to find mean, median and mode of given data.
ii.
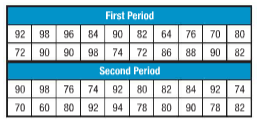
Draw stem and leaf plot for given data.
ii.
Answer to Problem 13.1MPS
Back to back stem and leaf plot for given data is
| First period | Stem | Second period |
| 4 | 6 | 0 |
| 6 4 2 2 0 | 7 | 0 4 4 6 8 8 |
| 8 6 4 2 2 0 | 8 | 0 0 0 2 2 4 |
| 8 8 6 2 0 0 0 0 | 9 | 0 0 2 2 2 4 8 |
Explanation of Solution
Given:
Calculations:
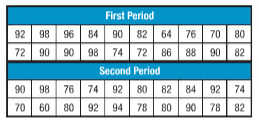
Stem and leaf plots shows the frequency of given data.
There are two parts of this plot namely stem and leaf. Stem shows first digit and leaf shows last digit.
We have given two different data. For this we has to draw back to back stem and leaf plot.
| First period | Stem | Second period |
| 4 | 6 | 0 |
| 6 4 2 2 0 | 7 | 0 4 4 6 8 8 |
| 8 6 4 2 2 0 | 8 | 0 0 0 2 2 4 |
| 8 8 6 2 0 0 0 0 | 9 | 0 0 2 2 2 4 8 |
Conclusion:
Therefore, we are able to draw back to back stem and leaf plot.
iii.
Calculate measures of variation for given data.
iii.
Answer to Problem 13.1MPS
Measures of variation for given data is,
| Measures of variation | First period | Second period |
| Range | 34 | 38 |
| Median | 75 | 81 |
| Upper Quartile | 75 | 77 |
| Lower Quartile | 90 | 91 |
| Interquartile range | 15 | 14 |
Explanation of Solution
Given:
Calculations:
Here, we have to calculate measures of variation and outlier for given set of data.
Measures of variation include range, upper quartile, lower quartile and interquartile range of given data.
Range is the difference between higher and lower data value.
Here, (Range) Firstperiod = 98-64 = 34
(Range)Secondperiod = 98-60 = 38
Median for first period is 85 and for second order is 81.
Upper quartile is the median of upper half set of data.
Here, (Upper quartile)Firstperiod is,
(Upper quartile)Secondperiod is,
Lower quartile is the median of lower half set of data.
Here, (lower quartile) Firstperiod is,
(Lower quartile)Secondperiod is,
Interquartile range is the difference between upper quartile and lower quartile.
Here, (Interquartile range) Firstperiod =90-75=15
(Interquartile range)Secondperiod =91-77=14
Conclusion:
Therefore, we are able to find measures of variation for given data.
Chapter SH Solutions
Pre-Algebra, Student Edition
Additional Math Textbook Solutions
College Algebra
Algebra and Trigonometry
College Algebra with Modeling & Visualization (6th Edition)
Elementary Algebra: Concepts and Applications (10th Edition)
College Algebra
Elementary Algebra
 Algebra and Trigonometry (6th Edition)AlgebraISBN:9780134463216Author:Robert F. BlitzerPublisher:PEARSON
 Contemporary Abstract AlgebraAlgebraISBN:9781305657960Author:Joseph GallianPublisher:Cengage Learning
 Linear Algebra: A Modern IntroductionAlgebraISBN:9781285463247Author:David PoolePublisher:Cengage Learning
 Algebra And Trigonometry (11th Edition)AlgebraISBN:9780135163078Author:Michael SullivanPublisher:PEARSON
 Introduction to Linear Algebra, Fifth EditionAlgebraISBN:9780980232776Author:Gilbert StrangPublisher:Wellesley-Cambridge Press
 College Algebra (Collegiate Math)AlgebraISBN:9780077836344Author:Julie Miller, Donna GerkenPublisher:McGraw-Hill Education


