
Concept explainers
Videos
(a)
To make a parallel boxplots of petal lengths for the two species.
(a)
Explanation of Solution
It is given in the question that the researchers want to know that can measurements of the petal length of flowers be of value when you need to determine the species of a certain flower. Thus, the box plots for the petal lengths for the two species are as follows:
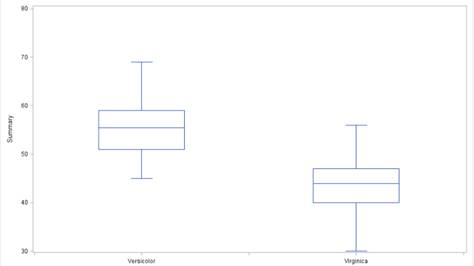
In this box plot the left box plot is for the species Versicolor and right box plot is for the species Virginica.
(b)
To describe the differences seen in the boxplots.
(b)
Explanation of Solution
It is given in the question that the researchers want to know that can measurements of the petal length of flowers be of value when you need to determine the species of a certain flower.In the above graph, the box plot on the left box plot is for the species Versicolor and right box plot is for the species Virginica. We can say that depending on the plot, the petal of Versicolor is larger than Virginica. And the box plot of the Virginica seems to be more
(c)
To write a
(c)
Answer to Problem 28RE
The interval is
Explanation of Solution
It is given in the question that the researchers want to know that can measurements of the petal length of flowers be of value when you need to determine the species of a certain flower.Thus, to find the confidence interval for mean we will use the calculator
(d)
To explain what your interval means.
(d)
Explanation of Solution
It is given in the question that the researchers want to know that can measurements of the petal length of flowers be of value when you need to determine the species of a certain flower. Thus, from the list given and by using the calculator
So, we are
(e)
To explain is there evidence of a difference in petal length based on your interval.
(e)
Answer to Problem 28RE
Yes, there is evidence of a difference in petal length based on your interval.
Explanation of Solution
It is given in the question that the researchers want to know that can measurements of the petal length of flowers be of value when you need to determine the species of a certain flower. Thus, from the list given and by using the calculator
So, we are
Chapter PVI Solutions
Stats: Modeling the World Nasta Edition Grades 9-12
Additional Math Textbook Solutions
An Introduction to Mathematical Statistics and Its Applications (6th Edition)
STATS:DATA+MODELS-W/DVD
Introductory Statistics
Elementary Statistics Using Excel (6th Edition)
Elementary Statistics: Picturing the World (6th Edition)


 MATLAB: An Introduction with ApplicationsStatisticsISBN:9781119256830Author:Amos GilatPublisher:John Wiley & Sons Inc
 Probability and Statistics for Engineering and th...StatisticsISBN:9781305251809Author:Jay L. DevorePublisher:Cengage Learning
 Statistics for The Behavioral Sciences (MindTap C...StatisticsISBN:9781305504912Author:Frederick J Gravetter, Larry B. WallnauPublisher:Cengage Learning
 Elementary Statistics: Picturing the World (7th E...StatisticsISBN:9780134683416Author:Ron Larson, Betsy FarberPublisher:PEARSON
 The Basic Practice of StatisticsStatisticsISBN:9781319042578Author:David S. Moore, William I. Notz, Michael A. FlignerPublisher:W. H. Freeman
 Introduction to the Practice of StatisticsStatisticsISBN:9781319013387Author:David S. Moore, George P. McCabe, Bruce A. CraigPublisher:W. H. Freeman