
Concept explainers
Videos
(a)
To use the
(a)
Explanation of Solution
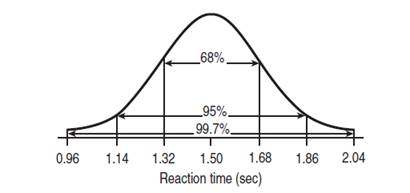
It is given in the question that the time measured from the moment the driver first sees the danger has a normal model with
(b)
To write a few sentences describing driver reaction times.
(b)
Explanation of Solution
It is given in the question that the time measured from the moment the driver first sees the danger has a normal model with mean of
(c)
To find out what percent of drivers have a reaction time less than
(c)
Answer to Problem 25RE
Explanation of Solution
It is given in the question that the time measured from the moment the driver first sees the danger has a normal model with mean of
Thus,
(d)
To find out what percent of drivers have a reaction time between
(d)
Answer to Problem 25RE
Explanation of Solution
It is given in the question that the time measured from the moment the driver first sees the danger has a normal model with mean of
Thus,
(e)
To find out what is the
(e)
Answer to Problem 25RE
Explanation of Solution
It is given in the question that the time measured from the moment the driver first sees the danger has a normal model with mean of
(f)
To describe the reaction times of the slowest
(f)
Explanation of Solution
It is given in the question that the time measured from the moment the driver first sees the danger has a normal model with mean of
Chapter PI Solutions
Stats: Modeling the World Nasta Edition Grades 9-12
Additional Math Textbook Solutions
Essentials of Statistics, Books a la Carte Edition (5th Edition)
Introductory Statistics
Introductory Statistics
Fundamentals of Statistics (5th Edition)
An Introduction to Mathematical Statistics and Its Applications (6th Edition)
Essentials of Statistics (6th Edition)


 MATLAB: An Introduction with ApplicationsStatisticsISBN:9781119256830Author:Amos GilatPublisher:John Wiley & Sons Inc
 Probability and Statistics for Engineering and th...StatisticsISBN:9781305251809Author:Jay L. DevorePublisher:Cengage Learning
 Statistics for The Behavioral Sciences (MindTap C...StatisticsISBN:9781305504912Author:Frederick J Gravetter, Larry B. WallnauPublisher:Cengage Learning
 Elementary Statistics: Picturing the World (7th E...StatisticsISBN:9780134683416Author:Ron Larson, Betsy FarberPublisher:PEARSON
 The Basic Practice of StatisticsStatisticsISBN:9781319042578Author:David S. Moore, William I. Notz, Michael A. FlignerPublisher:W. H. Freeman
 Introduction to the Practice of StatisticsStatisticsISBN:9781319013387Author:David S. Moore, George P. McCabe, Bruce A. CraigPublisher:W. H. Freeman