Concept explainers
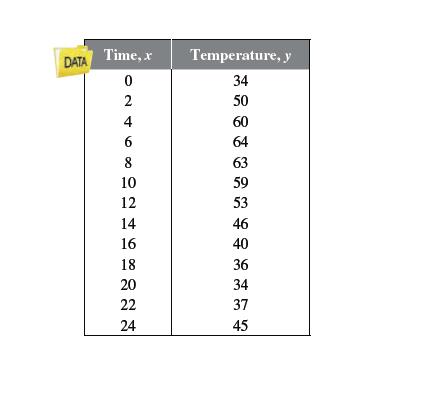
Temperature The table shows the temperatures y (in degrees Fahrenheit) in a city over a 24-hour period. Let x represent the time of day, where x = 0 corresponds to 6 a.m.

These data can be approximated by the model
Use a graphing utility to create a
same viewing window.
How well does the model fit the data?
Use the graph to approximate the times when the temperature was increasing and
decreasing.
Use the graph to approximate the maximum and minimum temperatures during this
24-hour period.
Could this model predict the temperatures in the city during the next 24-hour period?
Why or why not?
Trending nowThis is a popular solution!

Chapter P Solutions
Trigonometry (MindTap Course List)
- Use the Vertical Line Test to determine whether the graph represents y as a function of x.arrow_forwardMarriage Rate The marriage rate per 1000 unmarried women for the years 1987–2014 is given by 132x + 1000y = 9570 where x is the number ofyears after 1980.a. Find the x-intercept of the graph of this function. b. Find and interpret the y-intercept of the graph ofthis function.c. Graph this function, using the intercepts.(Source: National Vital Statistics Report)arrow_forwardRefine your table by calculating values of x that go up in increments of 100 between these two numbers. You can refine even further if you wish. x, number of books sold Income with publisher A, ($) A = Income with publisher B, ($) B = What is your best estimate for the number of books sold that make the plans equal? Use the numerical data above to graphically compare the incomes. Construct a graph to model both publishing plans on the same Cartesian Plane and attach it to this tutorial (you may use Excel or DESMOS if you wish). Which quantity is to plotted on which axis? Properly label and title your graph. What is your best estimate from your graph? Now solve the problem algebraically. You are solving a system of equations by substitution. Part C. Comment on the Process and Interpret the Results Are the solutions you obtained numerically, graphically and algebraically consistent? What factors must the students consider when deciding between these two offers?arrow_forward
- A cup of soup is left on a countertop to cool. The table below gives the temperatures, in degrees Fahrenheit, of the soup recorded over a 10-minute period. Time in Minutes (x) | Temperature in ºF (y) 0. 180.2 1658 4. 146.3 6. 135.4 8. 127.7 10 110.5 a) Graph the scatter plot on your calculator. Is the data linear, quadratic, or exponential? b) Use the appropriate regression to find the equation of best fit. c) Predict the temperature after 15 minutes. Is this interpolation or extrapolation?arrow_forwardI used a function to model data from 1990 through 2015. The independent variable in my model represented the number of years after 1990, so the function’s domain was {x| x = 0, 1, 2, 3, ......, 25}.Determine whether the statement makes sense or does not make sense, and explain your reasoning.arrow_forwardA pediatrician wants to determine the relation that exists between a child's height, x, and head circumference, y. She randomly selects 11 children from her practice, measures their heights and head circumferences, and obtains the accompanying data. Complete parts (a) through (g) below. E Click the icon to view the children's data, Question Help ▼ Interpret the y-intercept, it approprate. Select the correct choice below and, it necessary, till in the answer box to complete your choice. O A. For every inch increase in head circumference, the height increases by in., on average. (Round to one decimal place as needed.) O B. For a height of 0 inches, the head circumference is predicted to be (Round to one decimal place as needed.) in. O C. For every inch increase in height, the head circumference increases by in., on average. (Round to one decimal place as needed.) O D. For a head circumference of 0 inches, the height is predicted to be in. (Round to one decimal place as needed.) O E. It…arrow_forward
- A gaming lobby allows only 150 players at a time. The time taken to fill up the lobby depends on the number of viewers that are on the stream and try to get into the lobby. This relationship is shown in the graph given below. Check the box that accurately describes describes this relationship. Circle the correct option with respect 1 to the time taken. The relationship between time taken to fill the lobby and the number of viewers is: 151 (150, 15) 10 Steady Unsteady (1000, 1) 200 400 600 800 1000 No. of viewers Duration to fill lobby (in min)arrow_forwardIdentify the scenario that is a linear relationship or function. o direct variation O index of refraction O pressure O workarrow_forwardCould you please show me how to calcualte this (the circled one) on excel, I want the whole formula detail please the answer shown is correct.arrow_forward
 Big Ideas Math A Bridge To Success Algebra 1: Stu...AlgebraISBN:9781680331141Author:HOUGHTON MIFFLIN HARCOURTPublisher:Houghton Mifflin Harcourt
 Holt Mcdougal Larson Pre-algebra: Student Edition...AlgebraISBN:9780547587776Author:HOLT MCDOUGALPublisher:HOLT MCDOUGAL
- Algebra & Trigonometry with Analytic GeometryAlgebraISBN:9781133382119Author:SwokowskiPublisher:Cengage
 Glencoe Algebra 1, Student Edition, 9780079039897...AlgebraISBN:9780079039897Author:CarterPublisher:McGraw Hill
 Algebra: Structure And Method, Book 1AlgebraISBN:9780395977224Author:Richard G. Brown, Mary P. Dolciani, Robert H. Sorgenfrey, William L. ColePublisher:McDougal Littell


