
Videos
To graph: The inequality
Explanation of Solution
Given information:
The square root inequality
Graph:
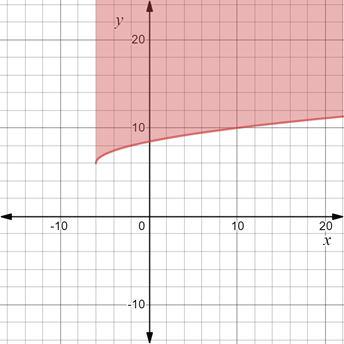
First graph the boundary of the inequality that is
Since, the inequality is greater than or equal to so the line will be solid.
Also the square root function does not accept negative value, so domain is
Observe that y is greater than or equal therefore the shaded region will lie above the boundary and within the range. It will also include points of boundary.
Interpretation:
The region represented by the inequality is unbounded. As the value of xincreases the corresponding values of y increases. The graph
Chapter EP Solutions
Algebra 2
Additional Math Textbook Solutions
College Algebra (7th Edition)
College Algebra
Linear Algebra and Its Applications (5th Edition)
Elementary Algebra


 Algebra and Trigonometry (6th Edition)AlgebraISBN:9780134463216Author:Robert F. BlitzerPublisher:PEARSON
 Contemporary Abstract AlgebraAlgebraISBN:9781305657960Author:Joseph GallianPublisher:Cengage Learning
 Linear Algebra: A Modern IntroductionAlgebraISBN:9781285463247Author:David PoolePublisher:Cengage Learning
 Algebra And Trigonometry (11th Edition)AlgebraISBN:9780135163078Author:Michael SullivanPublisher:PEARSON
 Introduction to Linear Algebra, Fifth EditionAlgebraISBN:9780980232776Author:Gilbert StrangPublisher:Wellesley-Cambridge Press
 College Algebra (Collegiate Math)AlgebraISBN:9780077836344Author:Julie Miller, Donna GerkenPublisher:McGraw-Hill Education