
A
To draw: K’s indifference curve.
A
Explanation of Solution
| Quantity of songs | Quantity of movies |
| 0 | 8 |
| 1 | 6 |
| 2 | 4 |
| 3 | 2 |
| 4 | 0 |
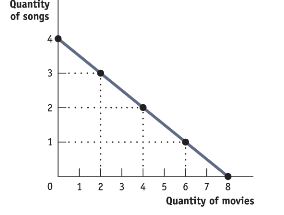
As per the given table, the quantity of movies is plotted on the x-axis, and the quantity of songs is plotted on the y-axis. Thus, a downward-sloping indifference curve is formed.
Introduction:
Indifference curve is defined as a chart depicting various combinations of two commodities or goods that leave the consumer equally satisfied or equally well off.
B
To state: 2 properties that each indifference curve for ordinary goods represents.
B
Explanation of Solution
The 2 properties that each indifference curve for ordinary goods represents are:
- Negative slope: that is it is downward sloping. That is with an increase in the good on the y-axis, the good on the x-axis would decrease.
- Convex shape: is represented by a line with a slope that decreases in value from left to right.
Introduction:
Indifference curve is defined as a chart depicting various combinations of two commodities or goods that leave the consumer equally satisfied or equally well off.
C
To state: Is k’s indifference curve depicting the 2 properties that are named in part b?
C
Explanation of Solution
The 2 properties that each indifference curve for ordinary goods represents are:
- Negative slope: K’s indifference curve depicts a negative slope. As more movies are downloaded, then song downloads should be less in order to provide K with the same utility as before. So, this trade-off of more of a good and less of another gives the indifference curve a negative slope.
- Convex shape: k’s indifference curve does not have a convex shape. K’s Ic curve is a straight line with a constant slope, instead of being a convex line with a slope that decreases in value from left to right.
Introduction:
Indifference curve is defined as a chart depicting various combinations of two commodities or goods that leave the consumer equally satisfied or equally well off.
Chapter EMD Solutions
Krugman's Economics For The Ap® Course


 Principles of Economics (12th Edition)EconomicsISBN:9780134078779Author:Karl E. Case, Ray C. Fair, Sharon E. OsterPublisher:PEARSON
 Engineering Economy (17th Edition)EconomicsISBN:9780134870069Author:William G. Sullivan, Elin M. Wicks, C. Patrick KoellingPublisher:PEARSON
 Principles of Economics (MindTap Course List)EconomicsISBN:9781305585126Author:N. Gregory MankiwPublisher:Cengage Learning
 Managerial Economics: A Problem Solving ApproachEconomicsISBN:9781337106665Author:Luke M. Froeb, Brian T. McCann, Michael R. Ward, Mike ShorPublisher:Cengage Learning
 Managerial Economics & Business Strategy (Mcgraw-...EconomicsISBN:9781259290619Author:Michael Baye, Jeff PrincePublisher:McGraw-Hill Education