
a)
The hypothetical indifference curves for S by locating the bundles on curves where it is assumed that goods are ordinary.
a)
Explanation of Solution
As it is assumed that goods are ordinary then the following graph shows the hypothetical indifference curves for S by locating the bundles on curves.
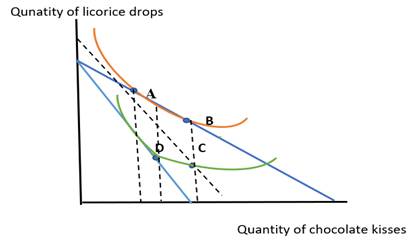
In this graph, the horizontal axis represents the number of chocolate kisses and the vertical axis shows the number of licorice drops.
There are two indifference curves on the graph which show the location of bundles, A, B, C, and D. A and B bundles are shown on one line where the quantity of chocolate kisses is 1 for A, 3 for B and the number of licorice drops is 3 for A and 2 for B. The second line represents the bundles of C and D where D point shows the 3 units of chocolate kisses and 2 units of drops while point D indicates 1 unit of drops and 2 units of chocolate kisses.
Introduction: The graphical representation of a combination of products that offer a similar level of satisfaction to consumers renders them indifferent is called an indifference curve.
b)
The shaded area that represents H's Cutlery's initial economic profit and explains what will happen to it in the long run.
b)
Explanation of Solution
If the number of utils is not known and the quantity which is more would be considered better then, the ranking of S will move as B at the top because this is the bundle at which the quantity of both products is higher and when the more consumption is gained then it will be the highest better. Therefore, the rank will be considered as B at the highest, then A and C will deliver moderate consumption which will be in the middle but D would be at the lowest in ranking as it involves low quantity consumption.
Introduction: The graphical representation of a combination of products that offer a similar level of satisfaction to consumers renders them indifferent is called an indifference curve.
Want to see more full solutions like this?
Chapter EMD Solutions
Krugman's Economics For The Ap® Course


 Principles of Economics (12th Edition)EconomicsISBN:9780134078779Author:Karl E. Case, Ray C. Fair, Sharon E. OsterPublisher:PEARSON
 Engineering Economy (17th Edition)EconomicsISBN:9780134870069Author:William G. Sullivan, Elin M. Wicks, C. Patrick KoellingPublisher:PEARSON
 Principles of Economics (MindTap Course List)EconomicsISBN:9781305585126Author:N. Gregory MankiwPublisher:Cengage Learning
 Managerial Economics: A Problem Solving ApproachEconomicsISBN:9781337106665Author:Luke M. Froeb, Brian T. McCann, Michael R. Ward, Mike ShorPublisher:Cengage Learning
 Managerial Economics & Business Strategy (Mcgraw-...EconomicsISBN:9781259290619Author:Michael Baye, Jeff PrincePublisher:McGraw-Hill Education