
Concept explainers
Videos
To make:
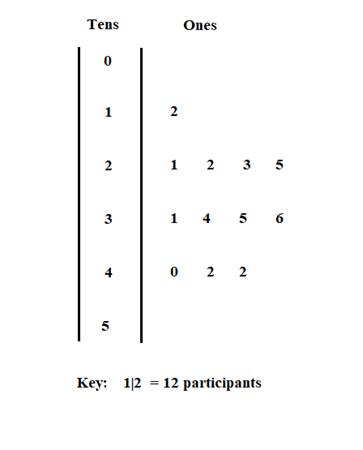
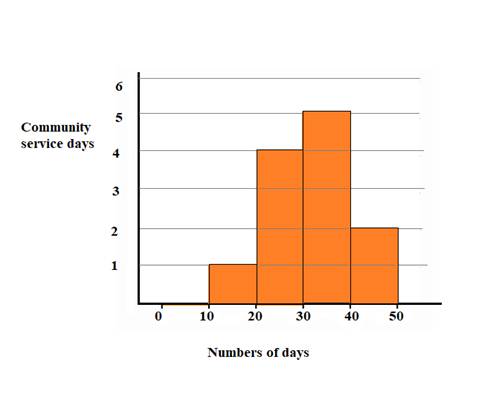
A stem and leaf plot and a histogram for the given data.
Explanation of Solution
Given:
Numbers of participants in twelve community service days sponsored by a school.
Calculation:
First of all, we will arrange our given data in ascending order as:
Now we will draw two columns. We know that left column of stem and leaf plot represents tens place and right column represents ones place.
Upon using our given data, we will get our required stem and leaf plot as shown below:
To make a histogram, we will make intervals for the number of participants as:
| Number of participants | Data points | Number of community service days |
| 0-10 | 0 | 0 |
| 11-20 | 12 | 1 |
| 21-30 | 21, 22, 23, 25 | 4 |
| 31-40 | 31, 34, 35, 36, 40 | 5 |
| 41-50 | 42, 42 | 2 |
Upon using our given data, we will get our required stem and leaf plot as shown below:
Chapter CSR Solutions
Holt Mcdougal Larson Pre-algebra: Student Edition 2012
Additional Math Textbook Solutions
College Algebra (10th Edition)
Intermediate Algebra for College Students (7th Edition)
Elementary and Intermediate Algebra: Concepts and Applications (7th Edition)
Intermediate Algebra (7th Edition)


 Algebra and Trigonometry (6th Edition)AlgebraISBN:9780134463216Author:Robert F. BlitzerPublisher:PEARSON
 Contemporary Abstract AlgebraAlgebraISBN:9781305657960Author:Joseph GallianPublisher:Cengage Learning
 Linear Algebra: A Modern IntroductionAlgebraISBN:9781285463247Author:David PoolePublisher:Cengage Learning
 Algebra And Trigonometry (11th Edition)AlgebraISBN:9780135163078Author:Michael SullivanPublisher:PEARSON
 Introduction to Linear Algebra, Fifth EditionAlgebraISBN:9780980232776Author:Gilbert StrangPublisher:Wellesley-Cambridge Press
 College Algebra (Collegiate Math)AlgebraISBN:9780077836344Author:Julie Miller, Donna GerkenPublisher:McGraw-Hill Education