
Fundamentals of Statistics (5th Edition)
5th Edition
ISBN: 9780134508306
Author: Michael Sullivan III
Publisher: PEARSON
expand_more
expand_more
format_list_bulleted
Videos
Textbook Question
Chapter B.4, Problem 1AYU
Skill Building
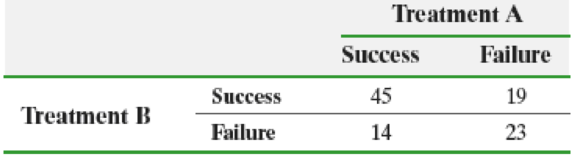
In Problems 1 and 2, test whether the population proportions differ at the α = 0.05 level of significance by determining (a) the null and alternative hypotheses, (b) the test statistic, (c) the critical value, and (d) the P-value. Assume that the samples are dependent and were obtained randomly.
1. 
Expert Solution & Answer

Trending nowThis is a popular solution!

Students have asked these similar questions
Salary information regarding male and female employees of a large company is shown below.
Male
Female
Sample Size
60
30
Sample Mean Salary (in $1000)
45
40
Population Variance ()
120
70
If you are interested in testing whether or not the population average salary of males is significantly greater than that of females, at α = .05, the conclusion is that the population
a) average salary of males is greater than females cannot be proved.
b) average salary of males is significantly greater than females.
c) salaries of males and females are equal.
d) average salary of males is significantly lower than females.
In what circumstances is the z score used instead of a t statistic for a hypothesis test?
a.
given the population mean, the z score is used when the standard deviation is unknown
b.
given the population mean, the z score is used when the population variance or standard deviation is known
c.
given the population mean, the z score is used if you are not sure that the population distribution is normal
d.
given the population mean, the z score is used when the sample size is 30 or larger
In tests involving a sample mean or proportion, the alternative hypothesis will state that the population parameter is equal to some value.
□ True □ False
a) When a claim or assertion is involved in hypothesis testing, the null hypothesis is always the same as the statement itself.
□ True □ False
b) When a null hypothesis can be rejected by an extreme result in one direction only, a two-tail test is appropriate.
□ True □ False
c) An Internal Revenue Service official says, “The percentage of taxpayers who overpay the taxes they owe is considerably less than 10%.” In the related hypothesis test, we should apply the “Missouri Rule” in setting up the null and alternative hypotheses.
□ True □ False
Chapter B.4 Solutions
Fundamentals of Statistics (5th Edition)
Ch. B.4 - Skill Building In Problems 1 and 2, test whether...Ch. B.4 - In Problems 1 and 2, test whether the population...Ch. B.4 - NW 3. Hazardous Activities In a survey of 3029...Ch. B.4 - Income Taxes A Gallup organization survey asked...Ch. B.4 - Voice-Recognition Systems Have you ever been...Ch. B.4 - Poison Ivy Look back at the data in Table 3 on...Ch. B.4 - Gun Laws and Capital Punishment The General Social...Ch. B.4 - Children and Childcare The General Social Survey...
Knowledge Booster


Learn more about
Need a deep-dive on the concept behind this application? Look no further. Learn more about this topic, statistics and related others by exploring similar questions and additional content below.Similar questions
- Population Genetics In the study of population genetics, an important measure of inbreeding is the proportion of homozygous genotypesthat is, instances in which the two alleles carried at a particular site on an individuals chromosomes are both the same. For population in which blood-related individual mate, them is a higher than expected frequency of homozygous individuals. Examples of such populations include endangered or rare species, selectively bred breeds, and isolated populations. in general. the frequency of homozygous children from mating of blood-related parents is greater than that for children from unrelated parents Measured over a large number of generations, the proportion of heterozygous genotypesthat is, nonhomozygous genotypeschanges by a constant factor 1 from generation to generation. The factor 1 is a number between 0 and 1. If 1=0.75, for example then the proportion of heterozygous individuals in the population decreases by 25 in each generation In this case, after 10 generations, the proportion of heterozygous individuals in the population decreases by 94.37, since 0.7510=0.0563, or 5.63. In other words, 94.37 of the population is homozygous. For specific types of matings, the proportion of heterozygous genotypes can be related to that of previous generations and is found from an equation. For mating between siblings 1 can be determined as the largest value of for which 2=12+14. This equation comes from carefully accounting for the genotypes for the present generation the 2 term in terms of those previous two generations represented by for the parents generation and by the constant term of the grandparents generation. a Find both solutions to the quadratic equation above and identify which is 1 use a horizontal span of 1 to 1 in this exercise and the following exercise. b After 5 generations, what proportion of the population will be homozygous? c After 20 generations, what proportion of the population will be homozygous?arrow_forwardIn a test of hypothesis, the null hypothesis is that the population mean is equal to 24 and the alternative hypothesis is that the population mean is not equal to 24. The test is to be made at the 5% significance level. The critical values of z are: a. –2.07 and 2.07 b. –1.65 and 1.65 c. –1.96 and 1.96 d. –2.17 and 2.17arrow_forwardYou are conducting a test of homogeneity for the claim that two different populations have the same proportions of the following two characteristics. Here is the sample data. Category Population#1 Population#2 A 19 75 B 51 69 The expected observations for this table would be Category Population#1 Population#2 A B The resulting Pearson residuals are: Category Population#1 Population#2 A B What is the chi-square test-statistic for this data?χ2=χ2= Report all answers accurate to three decimal places.arrow_forward
- You are conducting a test of homogeneity for the claim that two different populations have the same proportions of the following two characteristics. Here is the sample data. Category Population#1 Population#2 A 41 74 B 36 69 The expected observations for this table would be Category Population#1 Population#2 A B The resulting Pearson residuals are: Category Population#1 Population#2 A B What is the chi-square test-statistic for this data?χ2=Report all answers accurate to three decimal places.arrow_forward3. A suitable null hypothesis worth evaluating in regression is the following: a) all population means are unequal b) all population means are equal c) the sample data was not drawn from the population d) the population regression slope is equal to 0arrow_forward
arrow_back_ios
arrow_forward_ios
Recommended textbooks for you
 Functions and Change: A Modeling Approach to Coll...AlgebraISBN:9781337111348Author:Bruce Crauder, Benny Evans, Alan NoellPublisher:Cengage Learning
Functions and Change: A Modeling Approach to Coll...
Algebra
ISBN:9781337111348
Author:Bruce Crauder, Benny Evans, Alan Noell
Publisher:Cengage Learning
Hypothesis Testing using Confidence Interval Approach; Author: BUM2413 Applied Statistics UMP;https://www.youtube.com/watch?v=Hq1l3e9pLyY;License: Standard YouTube License, CC-BY
Hypothesis Testing - Difference of Two Means - Student's -Distribution & Normal Distribution; Author: The Organic Chemistry Tutor;https://www.youtube.com/watch?v=UcZwyzwWU7o;License: Standard Youtube License