MATLAB: An Introduction with Applications
6th Edition
ISBN: 9781119256830
Author: Amos Gilat
Publisher: John Wiley & Sons Inc
expand_more
expand_more
format_list_bulleted
Topic Video
Question
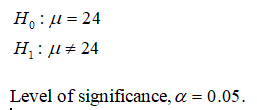
In a test of hypothesis, the null hypothesis is that the population
a. –2.07 and 2.07
b. –1.65 and 1.65
c. –1.96 and 1.96
d. –2.17 and 2.17
Expert Solution
arrow_forward
Step 1
The null and alternative hypothesis is,

The type of test is two tailed test
The type of test statistic is used in this problem is one sample z test
Step by stepSolved in 2 steps with 3 images

Knowledge Booster
Learn more about
Need a deep-dive on the concept behind this application? Look no further. Learn more about this topic, statistics and related others by exploring similar questions and additional content below.Similar questions
- Suppose that you want to perform a hypothesis test for a population mean. Assume that the population standard deviation is unknown and that the sample size is relatively small. In each part, the distribution shape of the variable under consideration is given. Decide whether you would use the t-test, the Wilcoxon signed-rank test, or neither. a. Triangular b. Symmetric bimodal c. Left skewedarrow_forwardFind the standardized test statistic estimate, z, to test the hypothesis that p1 > p2. Use α = 0.01. The sample statistics listed below are from independent samples. Sample statistics: n1 = 100, x1 = 38, and n2 = 140, x2 = 50 a.0.638 b.0.362 c.2.116 d.1.324arrow_forwardFind the test statistic, t, to test the hypothesis that u, = H,. Two samples are randomly selected and come from populations that are normal. The sample statistics are given below. Round to three decimal places. n= 14 X = 21 n2 = 12 X2 = 22 S1=2.5 $2 = 2.8 A. -0.909 B. - 0.954 C. -1.558 D. -0.915 Click to select your answer. 02/16/21 Ch 2.1 Homework P Type here to search 99+ a Gip 立arrow_forward
- Find the standardized test statistic estimate, z, to test the hypothesis that p, > p,. Use a= 0.01. The sample statistics listed below are from independent samples. Round to three decimal places. Sample statistics: n, = 100, x, = 38, and n2 = 140, X2 = 50 %3D %D O A. 0.638 B. 0.362 O C. 2.116 D. 1.324 S ting Click to select your answer. Type here to search hp 近arrow_forwardHelparrow_forwardThe t test for the difference between the means of two independent populations assumes that the respective Seleccione una: O A. populations are approximately normal. В. sample sizes are equal. С. sample variances are equal. O D. all of the abovearrow_forward
- Solve the problem. Find the standardized test statistic t for a sample with n = 15, x = 8.7, s = 0.8, and a = 0.05 if Ho: Hs 8.4. Round your answer to three decimal places. a. 1.452 b. 1.631 c. 1.728 d. 1.312arrow_forwardSet up the null and alternate hypotheses to test whether the population mean is equal to 10 when you have a sample mean. H0: Ha:arrow_forwardWhat percentage of scores should fall within ±1 SD for TADHD? Choices: 1. A higher percentage of scores than fell within ±1 SD for ADHD 2. A lower percentage of scores than fell within ±1 SD for ADHD 3. The same percentage of scores that fell within ±1 SD for ADHD What is true of a score of 65.55 for TADHD? Choices: 1. It falls within –1.5 SD of the mean and is thus unlikely to be due to chance 2. It falls within 1.5 SD of the mean and is thus unlikely to be due to chance 3. It falls outside –1.5 SD of the mean but is likely to be due to chance 4. It falls outside 1.5 SD of the mean but is likely to be due to chancearrow_forward
arrow_back_ios
arrow_forward_ios
Recommended textbooks for you
 MATLAB: An Introduction with ApplicationsStatisticsISBN:9781119256830Author:Amos GilatPublisher:John Wiley & Sons Inc
 Probability and Statistics for Engineering and th...StatisticsISBN:9781305251809Author:Jay L. DevorePublisher:Cengage Learning
 Statistics for The Behavioral Sciences (MindTap C...StatisticsISBN:9781305504912Author:Frederick J Gravetter, Larry B. WallnauPublisher:Cengage Learning
 Elementary Statistics: Picturing the World (7th E...StatisticsISBN:9780134683416Author:Ron Larson, Betsy FarberPublisher:PEARSON
 The Basic Practice of StatisticsStatisticsISBN:9781319042578Author:David S. Moore, William I. Notz, Michael A. FlignerPublisher:W. H. Freeman
 Introduction to the Practice of StatisticsStatisticsISBN:9781319013387Author:David S. Moore, George P. McCabe, Bruce A. CraigPublisher:W. H. Freeman

MATLAB: An Introduction with Applications
Statistics
ISBN:9781119256830
Author:Amos Gilat
Publisher:John Wiley & Sons Inc

Probability and Statistics for Engineering and th...
Statistics
ISBN:9781305251809
Author:Jay L. Devore
Publisher:Cengage Learning

Statistics for The Behavioral Sciences (MindTap C...
Statistics
ISBN:9781305504912
Author:Frederick J Gravetter, Larry B. Wallnau
Publisher:Cengage Learning

Elementary Statistics: Picturing the World (7th E...
Statistics
ISBN:9780134683416
Author:Ron Larson, Betsy Farber
Publisher:PEARSON

The Basic Practice of Statistics
Statistics
ISBN:9781319042578
Author:David S. Moore, William I. Notz, Michael A. Fligner
Publisher:W. H. Freeman

Introduction to the Practice of Statistics
Statistics
ISBN:9781319013387
Author:David S. Moore, George P. McCabe, Bruce A. Craig
Publisher:W. H. Freeman