
Videos
Voice-Recognition Systems Have you ever been frustrated by computer telephone systems that do not understand your voice commands? Quite a bit of effort goes into designing these systems to minimize voice-recognition errors. Researchers at the Oregon Graduate Institute of Science and Technology developed a new method of voice recognition (called a remapped network) that was thought to be an improvement over an existing neural network. The data shown in the next column are based on results of their research. Does the evidence suggest that the remapped network has a different proportion of errors than the neural network? Use the α = 0.05 level of significance.
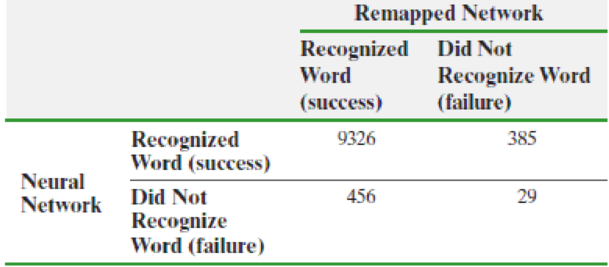
Source: Wei, Wei, Leen, Todd, Barnard, and Etienne, “A Fast Histogram-Based Postprocessor That Improves Posterior Probability Estimates.” Neural Computation 11:1235–1248.
Want to see the full answer?
Check out a sample textbook solution
Chapter B.4 Solutions
Fundamentals of Statistics (5th Edition)


- Which model—the one for parliaments or the one for ministries (or cabinets)—presented in the article has the greater explanatory power? How can you tell?arrow_forward"Coffee drinkers often claim that the caffeine in the coffee makes them more alert. A researcher wonders if this enhanced alertness is merely an illusion or if caffeine actually makes people more alert. To test the effect of caffeine on alertness, the researcher asks people to drink one cup of caffeinated coffee, one cup of plain water, one cup of caffeinated water, or one cup of decaffeinated coffee. After drinking the beverage each participant was given an electroencephalogram (EEG). The researcher hypothesized that the caffeinated beverages would result in greater electrical activity than the non-caffeinated beverages. Which of the following would be most likely to increase the size of the treatment effect in this study? " Only use people in the study who are between the ages of 25 and 35 rather than 25 and 75. Increase the amount of beverage participants drink from one cup to two cups. Have experienced EEG technicians collect data rather than train students…arrow_forwardYou may need to use the appropriate technology to answer this question. An automobile dealer conducted a test to determine if the time in minutes needed to complete a minor engine tune-up depends on whether a computerized engine analyzer or an electronic analyzer is used. Because tune-up time varies among compact, intermediate, and full-sized cars, the three types of cars were used as blocks in the experiment. The data obtained follow. Analyzer computerized electronic Car compact 50 41 Intermediate 56 45 Full Sized 62 46 Use ? = 0.05 to test for any significant differences. State the null and alternative hypotheses. H0: ?Computerized = ?ElectronicHa: ?Computerized ≠ ?ElectronicH0: ?Computerized ≠ ?ElectronicHa: ?Computerized = ?Electronic H0: ?Computerized = ?Electronic = ?Compact = ?Intermediate = ?Full-sizedHa: Not all the population means are equal.H0: ?Compact = ?Intermediate = ?Full-sizedHa: ?Compact ≠ ?Intermediate ≠ ?Full-sizedH0:…arrow_forward
- You may need to use the appropriate technology to answer this question. An automobile dealer conducted a test to determine if the time in minutes needed to complete a minor engine tune-up depends on whether a computerized engine analyzer or an electronic analyzer is used. Because tune-up time varies among compact, intermediate, and full-sized cars, the three types of cars were used as blocks in the experiment. The data obtained follow. Analyzer Computerized Electronic Compact 50 41 Car Intermediate 54 44 Full-sized 64 47 Use a = 0.05 to test for any significant differences. State the null and alternative hypotheses. O Ho: MCompact = "Intermediate = HFull-sized H: "Compact * "Intermediate * "Full-sized O Ho: "Compact * "Intermediate * HFull-sized H: "Compact "Intermediate = "Full-sized O Ho: Computerized = HElectronic H: "Computerized * HElectronic O Ho: "Computerized = HElectronic = "Compact = Intermediate = Full-sized H: Not all the population means are equal. O Ho: HComputerized *…arrow_forwardA researcher is interested in studying the effects of altitude on cognitive performance (e.g., perception, memory, problem solving, etc.). The researcher finds a group of experienced mountain climbers (n = 10) who volunteer to participate in the study. All of the climbers are tested at three different altitudes—at sea level (in the researchers’ laboratory at the University of California, San Diego), at the base camp (9,000 feet above sea level), and at 23,000 feet above sea level (at the peak of Mt. Denali in Alaska). At each location, the climbers perform a memory task (remember a list of 16 non-words like “biv”), and the accuracy of their memory is recorded (i.e., # of correctly recalled words). a. pls name the independent variable, dependent variable, levels of the IV, and the type of experiment design of this study (i.e., b/w- or w/i-subject design ) b. on what level of measurement is accuracy of memory assessed? (i.e., is it on nominal, ordinal, interval, or ratio?) View…arrow_forwardAppalachian Bear Rescue (ABR) is a not-for-profit organization located near the Great Smoky Mountains National Park. ABR's programs include the rehabilitation of orphaned and injured black bears, as well as research and education about Appalachian black bears. ABR provides the most natural environment possible for rehabilitating black bears before their release back into the wild. Recently, Katie Settlage performed a study to learn more about the Appalachian black bear population in the Great Smoky Mountains National Park. She and a team of researchers found 68 black bears in the park and took measurements such as paw size, weight, and shoulder height. The stem-and-leaf plots below show the shoulder heights (in centimeters) of the 40 male and 28 female bears from the study. Shoulder Heights (in cm) of Male Bears Shoulder Heights (in cm) of Female Bears 4 9 Key: 4 9 = 49 Key: 5|0 = 50 5 7 8 9 71 1 2 2 2 2 2 3 3 3 4 4 5 5 6 6 788 8 123 4 4 5 6 79 90 0 3 6 79 7 8 1 2 3 3 3 33 4 6 7 555 5…arrow_forward
- Question 2 An insurance company uses statistical learning to perform a risk analysis on a new short-term insurance product that covers the theft of vehicles. Recall that the banking and insurance industry is highly regulated, and they need to justify why a client has higher premiums or is rejected. Is the company more likely to use a tree-based model or a neural network to model this risk process? Substantiate your answer. (You can use the statistical flow chart in the Unit 3 notes for guidance, as well as what you know of the industry).arrow_forwardLet's assume that there are 500 people in a population. The researcher has access to all 500 participants, and sends a questionnaire that is accessed by a hyperlink. Of the 500 possible subjects, 485 complete it. Does this mean that the results generated from this study will be highly-accurate? What might cause the study to be unreliable?arrow_forwardDataset 2: Some are your team members are interested in how the emotional states of students are impacted by the types of language that instructors use to encourage student learning. They conducted a study where they had a group of participants either watch a really sad movie just before class or a funny comedy right before attending class. This movie was used to induce either a negative or positive emotional state prior to learning. Afterward, participants went to class and were split into group for group work. The instructor came around and either emphasized success or failure to each group. For example, the instructor said either, “you all are really capable of succeeding and mastering this material” or the instructor said, “I hope you all know this information well because it’s really hard and you could fail.” Participants then went back to their desks and wrote an independent essay based on what they were working on with their groups. The essays were graded separately to see how…arrow_forward
- A study was designed to determine whether video game players are better than non-video game players at crossing the street when presented with distractions. Participants (college students) entered a street-crossing simulator. The simulator was designed to have cars traveling at various high rates of speed in both directions. During the crossing, the students also performed a memory task as a distraction. The researchers found that students who are video game players took an average of 5.6 seconds to cross the street, with a standard deviation of 0.6 seconds. Assume that the time, x, to cross the street for the population of video game players has μ = 5.6 and o=0.6. Now consider a sample of 40 students and let x represent the sample mean time (in seconds) to cross the street in the simulator. Complete parts a and b below. a. Find P(x>5.8). P(x>5.8) = (Round to three decimal places as needed.)arrow_forwardDataset 2: Some are your team members are interested in how the emotional states of students are impacted by the types of language that instructors use to encourage student learning. They conducted a study where they had a group of participants either watch a really sad movie just before class or a funny comedy right before attending class. This movie was used to induce either a negative or positive emotional state prior to learning. Afterward, participants went to class and were split into group for group work. The instructor came around and either emphasized success or failure to each group. For example, the instructor said either, “you all are really capable of succeeding and mastering this material” or the instructor said, “I hope you all know this information well because it’s really hard and you could fail.” Participants then went back to their desks and wrote an independent essay based on what they were working on with their groups. The essays were graded separately to see how…arrow_forward
 Calculus For The Life SciencesCalculusISBN:9780321964038Author:GREENWELL, Raymond N., RITCHEY, Nathan P., Lial, Margaret L.Publisher:Pearson Addison Wesley,
 Linear Algebra: A Modern IntroductionAlgebraISBN:9781285463247Author:David PoolePublisher:Cengage Learning
 Elementary Linear Algebra (MindTap Course List)AlgebraISBN:9781305658004Author:Ron LarsonPublisher:Cengage Learning
 Big Ideas Math A Bridge To Success Algebra 1: Stu...AlgebraISBN:9781680331141Author:HOUGHTON MIFFLIN HARCOURTPublisher:Houghton Mifflin Harcourt