
Concept explainers
Videos
Stress in cows prior to slaughter. What is the level of stress (if any) that cows undergo prior to being slaughtered? To answer this question, researchers designed an experiment involving cows bred in Normandy. France (Applied Animal Behaviour Science, June 2010). The heart rate (beats per minute) of a cow was measured at four different pre-slaughter phases—(1) first phase of visual contact with pen mates. (2) initial isolation from pen mates for prepping, (3) restoration of visual contact with pen mates, and (4) first contact with human prior to slaughter. Data for eight cows (simulated from information provided in the article) are shown in the accompanying table. The researchers analyzed the data using an analysis of variance for a randomized block design. Their objective was to determine whether the
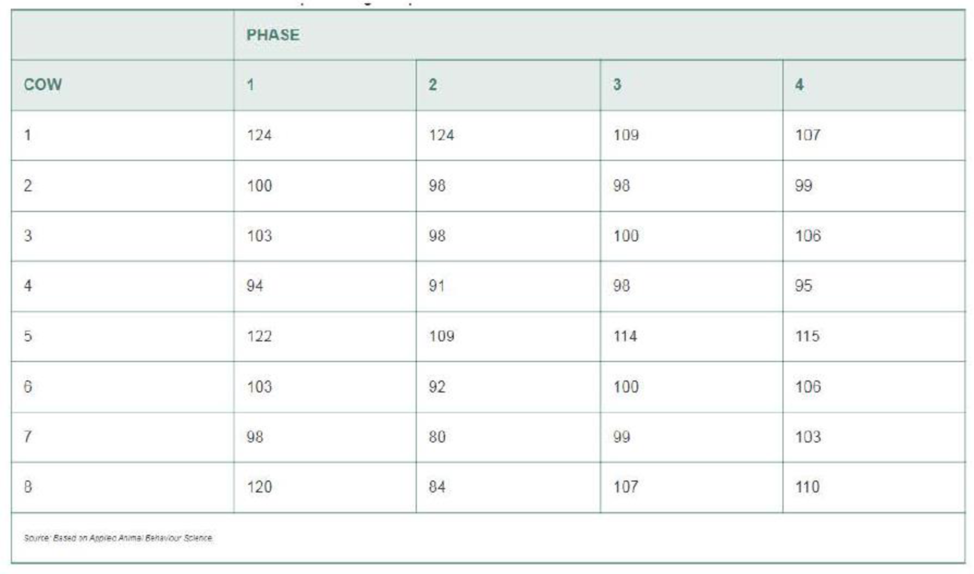
- a. Identify the treatments and blocks for this experimental design.
- b. Conduct the appropriate analysis using a statistical software package. Summarize the results in an ANOVA table.
- c. Is there evidence of differences among the mean heart rates of cows in the four pre-slaughter phases? Test using α = .05.
- d. If warranted, conduct a multiple comparisons procedure to rank the four treatment means. Use an experimentwise error rate of α = .05.
Want to see the full answer?
Check out a sample textbook solution
Chapter 9 Solutions
EBK STATISTICS FOR BUSINESS AND ECONOMI


- 7. Some years ago, a new brand of toothpaste was introduced in the United States. According to its advertisements, studies showed that it had "considerable success" in improving the health of a person's teeth. Suppose that these studies were designed in the following way. The manufacturer of this toothpaste chose three samples of seven people; the first sample agreed to use the new brand, the second sample used Brand A, and the third sample used Brand B. After six months, a dentist examined each person's teeth and scored the health of his or her teeth on a scale of 0 (lowest possible score) to 100 (highest possible score). The results were as follows: New Brand Brand A Brand B 65 58 54 71 60 38 53 63 43 55 90 61 34 95 94 82 89 96 77 62 82 The manufacturer of the new toothpaste says that the average score for the new brand is 2 points higher than for Brand A and 4 points higher than for Brand B. Would you agree with the manufacturer's advertisements? Explain.arrow_forwardThe manager of a men’s clothing catalog measured the market’s response to a $6 decrease in the usual price of his company’s oxford shirts by conducting a sales experiment. An A-B split was used to divide the company’s 120,000-customer mailing list into two groups. Customers in the control group were sent catalogs listing oxford shirts at their usual price of $40. Customers in the test group were sent catalogs listing the price of oxford shirts at $32.80. During the period of the test, customers in the control group purchased 700 oxford shirts, and customers in the test group purchased 889 oxford shirts. What is the independent variable in this sales experiment? What is the dependent variable in this sales experiment? What is the percent change in price in this experiment? What is price elasticity indicated by the results of this experiment.arrow_forwardAllegiant Airlines is considering an overbooking policy for one of its flights. The airplane has 50 seats, but Allegiant is considering accepting more reservations than seats because sometimes passengers do not show up for their flights, resulting in empty seats. The PassengerAppearance worksheet in the file Overbooking contains data on 1,000 passengers showing whether or not they showed up for their respective flights. In addition, Allegiant has conducted a field experiment to gauge the demand for reservations for the current flight. During this experiment, they did not limit the number of reservations for the flight to observe the uncensored demand. The following table summarizes the result of the field experiment. No. of Reservations Demanded Probability 48 0.05 49 0.05 50 0.15 51 0.30 52 0.25 53 0.10 54 0.10 Suppose Allegiant receives a marginal profit of $108 for each passenger who books a reservation (regardless of whether they show up). In addition, suppose…arrow_forward
- Describe the major differences between a randomized controlled experiment and a quasi-experimentarrow_forwardA tax on Cigarettes introduced in Mexico in 2012 increased the price of Cigarettes by about 10%. An evaluation of the first two years of this measure found that Cigarette consumption fell on average by 7.6%, with a larger decrease (11.7%) in low income households. The study also estimated an increase in consumption of alternatives to smoking, particularly Nicotine patches, of 2.1% (AYA, 2017) Explain factors that determine responsiveness to a price increase. Which of these factors might explain the difference in the economy and low income households?arrow_forwarda1 = (E1/0.1) = (150/0.1) = 45.8. is not make sense. How come?arrow_forward
- We have a random sample of workers from a large firm. In 2017, the firm ran a training program. Some workers did the training program, others did not. The firm now wants to assess the effect of the training on earnings. We use the following model to estimate the effect of a training program on annual earnings in 2018: ln(earn2018)=β0+β1train+β2ln(earn2016)+β3educ+β4exper+u where earn2018 = individual total annual earnings in 2018 in dollars train = a dummy variable that takes the value 1 if the individual worker did the training in 2017 and 0 otherwise earn2016 = individual total annual earnings in 2016 in dollars educ = the individual's years of education exper = the individual's years of experience Now, I want to test whether the effect of an additional year of education increases earnings by twice as much as an additional year of experience. My null hypothesis is H0:β3=2β4. To get the standard error I need to conduct this hypothesis test, I rearrange or re-parameterise…arrow_forwardAccording to Wine-Searcher, wine critics generally use a wine-scoring scale to communicate their opinions on the relative quality of wines. Wine scores range from 0 to 100, with a score of 95 – 100 indicating a great wine, 90 – 94 indicating an outstanding wine, 85 – 89 indicating a very good wine, 80 – 84 indicating a good wine, 75 - 79 indicating a mediocre wine, and below 75 indicating that the wine is not recommended. Random ratings of a pinot noir recently produced by a newly established vineyard in 2018 follow: Excel File: data07-11.xlsx 87 91 86 82 72 91 60 77 80 79 83 96 a. Develop a point estimate of mean wine score for this pinot noir (to 2 decimals). b. Develop a point estimate of the standard deviation for wine scores received by this pinot noir (to 4 decimals).arrow_forwardJachuck et al. (1982) report on a drug designed to reduce hypertension (high blood pressure). Such hypotensive drugs are frequently effective but are also linked to side effects like irritability and a decline in energy. Seventy-five patients with mild hypertension were put on hypotensive drugs and their progress was monitored by doctors and spouses. When asked to rate the treated patients as improved, worse, or unchanged, the doctors rated all 75 patients as "improved." Meanwhile, the spouses rated 74 of the 75 patients as "worse." Why might spouses and doctors differ in their opinion about the effect of going on blood pressure medication?arrow_forward
- Investigators enrolled 2,100 women in a study and followed them monthly to determine the incidence rate of heart disease. After one month of the first period of observation, none had a new diagnosis of heart disease, but 100 had died. In the second observation period which lasted for three months, 1 had a new diagnosis of heart disease within 1 month, and another 99 died within 2 months. In the third observation period which lasted for four months, another 7 had new diagnoses of heart disease and 793 died within 2 months. Calculate the incidence rate of heart disease among this cohort. Express in 2 decimal places as number of new cases per 1,000 person-time.arrow_forwardExercise Annika spends all of her income on golf and pancakes. Greens fees at a local golf course are $10 per round. Pancake mix is $2 per box. When Annika's income is $100 per week, she buys 5 boxes of pancake mix and 9 rounds of golf. When Annika's income rises to $120 per week, she buys 10 boxes of pancake mix and 10 rounds of golf. Based on these figures, determine whether each of the following statements is true or false, and briefly explain your reasoning 1. Golf is a normal good, and pancake mix is an inferior good 2. Golf is a luxury good 3. Pancakes are a luxury goodarrow_forwardDo waiters or waitresses earn larger tips To answer this Do waiters or waitresses earn larger tips? To answer this question, a restaurant consultant undertook a preliminary study. The study involved measuring the percentage of the total bill left as a tip for one randomly selected waiter and one randomly selected waitress in each of 50 restaurants during a 1-week period. What conclusions can be drawn from these data? Do waiters or waitresses earn larger tips To answer thisarrow_forward

 Principles of Economics (12th Edition)EconomicsISBN:9780134078779Author:Karl E. Case, Ray C. Fair, Sharon E. OsterPublisher:PEARSON
 Engineering Economy (17th Edition)EconomicsISBN:9780134870069Author:William G. Sullivan, Elin M. Wicks, C. Patrick KoellingPublisher:PEARSON
 Principles of Economics (MindTap Course List)EconomicsISBN:9781305585126Author:N. Gregory MankiwPublisher:Cengage Learning
 Managerial Economics: A Problem Solving ApproachEconomicsISBN:9781337106665Author:Luke M. Froeb, Brian T. McCann, Michael R. Ward, Mike ShorPublisher:Cengage Learning
 Managerial Economics & Business Strategy (Mcgraw-...EconomicsISBN:9781259290619Author:Michael Baye, Jeff PrincePublisher:McGraw-Hill Education